HandbookResults
Calculate
This page shows the two ways to turn a model into numbers: a quick calculation on the canvas, and the Results page, which calculates many products and indicators at once. It also explains what PrismLCA does when you press Calculate, and why some calculations take longer than others.
What a calculation needs#
Every calculation answers one question: how large is the impact of one unit of this product, measured with this indicator? So it always needs two things.
- A functional unit
- The process you calculate, for one unit of its reference product — one reel, 1 kg of granulate, 1 kWh. On the canvas this is exactly one selected process. The FU pill in the toolbar shows the unit, for example FU: 1 unit; until exactly one process is selected it says FU: select a process. See the glossary for the term.
- An impact indicator
- One indicator of an LCIA method, such as climate change in kg CO2-eq. Methods come with your background database; Impact methods explains what they are and how to choose.
Everything else comes from the model itself: the amounts on the arrows, the parameters and formulas behind them, and the background datasets your processes are linked to.
Calculate on the canvas#
The quickest check while you model. It calculates one process with one indicator and writes the result straight onto the canvas.
Choose the indicator#
Open the method list in the model toolbar, right of the FU pill. It lists every indicator of every method in the workspace. A ★ marks the standard reporting indicator of its category — the one to take unless you have a reason for a variant. Hover the list to read the full name; the box is narrower than most names.
Select one process#
Click the process whose impact you want — usually the product at the end of your system. Calculate only works with exactly one selected process; with none or several, its tooltip says Select one process as the functional unit.
Press Calculate#
The button at the right end of the toolbar. While it runs, it reads Calculating….
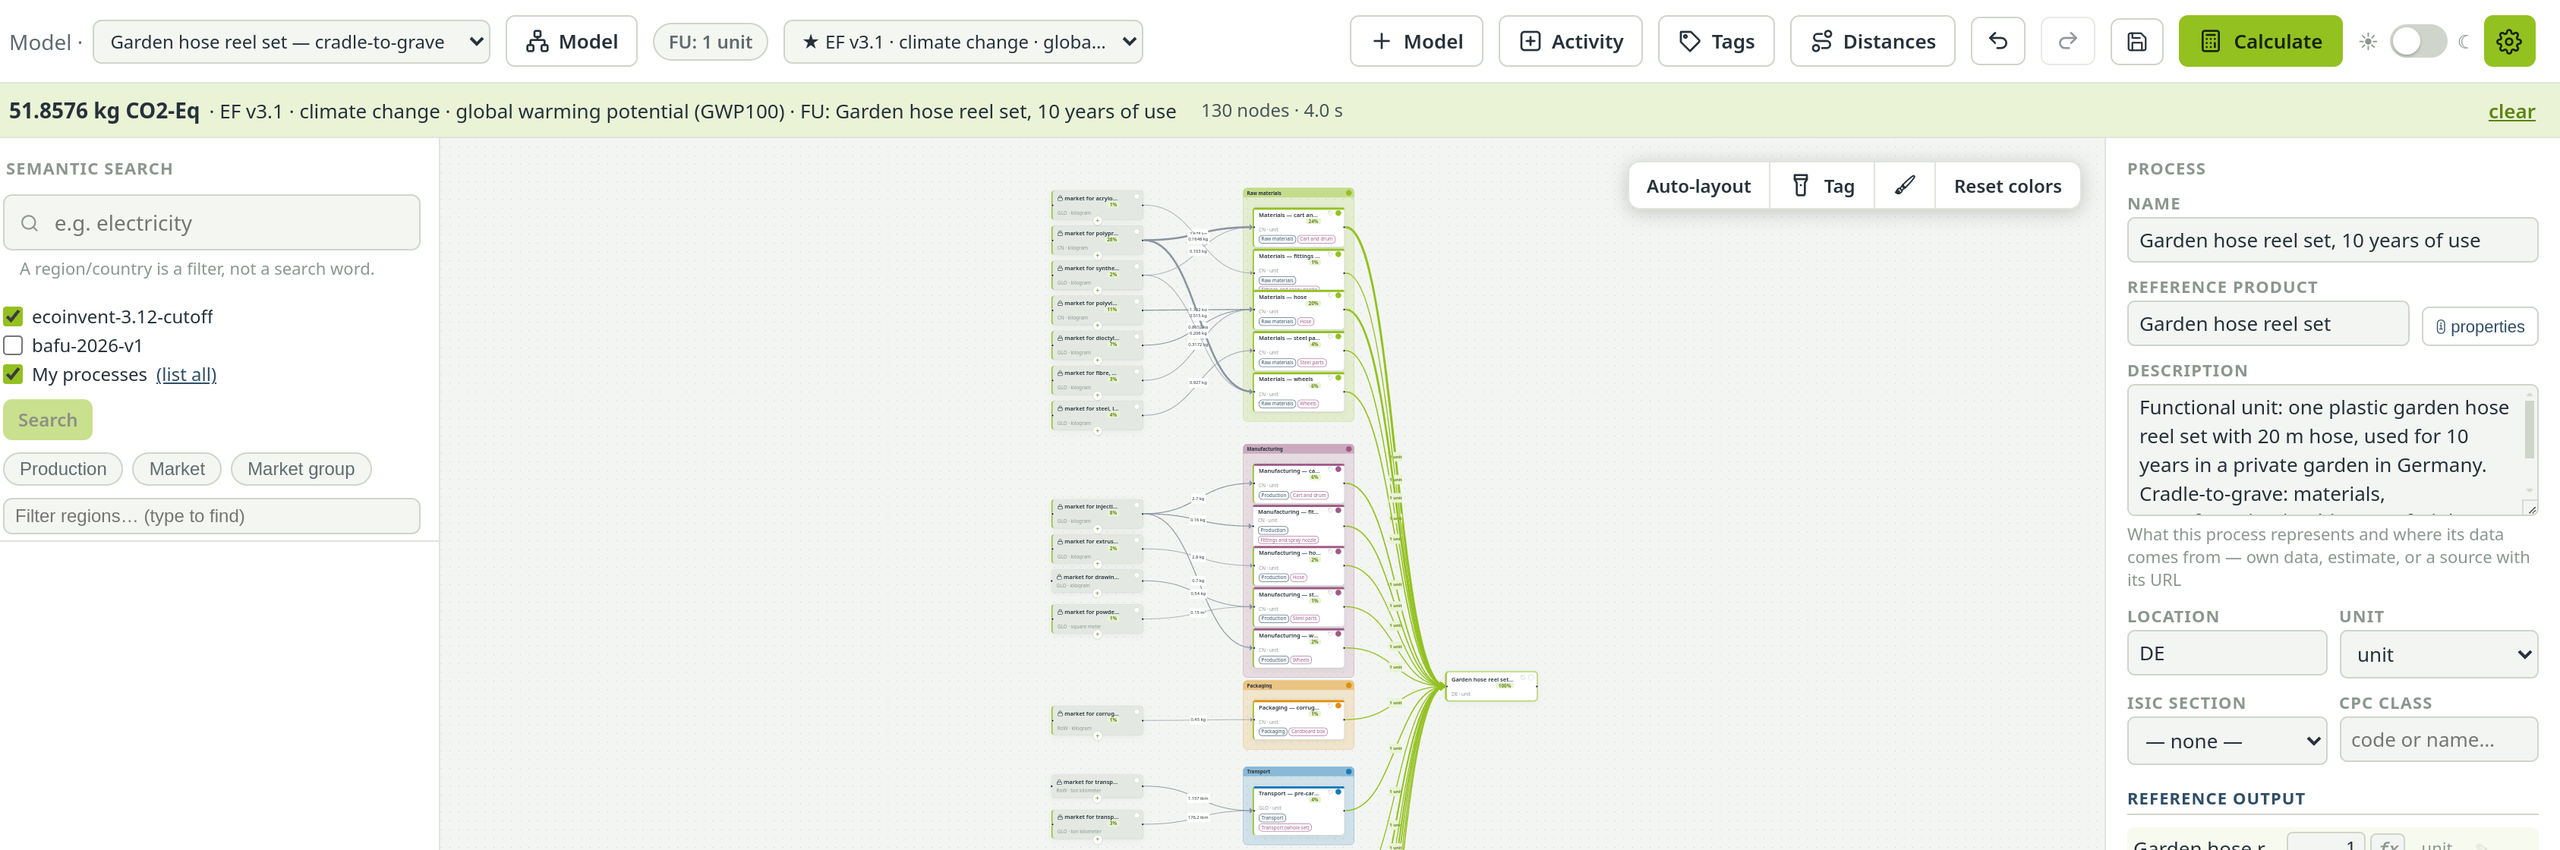
The result appears in three places:
- The result bar above the canvas shows the score with its unit, the method, the functional unit (the process you calculated, by name), how many nodes were part of the calculation and how many seconds it took. clear at its right end removes the result and everything below from the canvas.
- Each process box shows its share of the total in percent. That is the fastest way to spot the process that carries the result.
- The arrows get thicker the larger the share that flows through them.
The canvas result is a snapshot. Change an amount or a parameter and it no longer matches the model; press Calculate again. It is also only shown on the Model page — for comparisons, tables and charts, use the Results page.
Calculate many things at once: the Results page#
Open Results in the sidebar. Its first tab, also called Results, calculates any number of subjects (the things you compare) against any number of indicators in one run.
Pick subjects#
The page opens on your model's reference process — the one no other process in the model consumes, or the one that expresses the Reference quantity if you set one in Model info. Add more under Subjects: more processes of this model, scenarios, processes of other models, or datasets straight from a database.
Pick indicators#
Under Indicators, choose + Add indicator, pick a method family on the left and click the indicators you want. ★ marks the recommended one, as in the toolbar.
Press Calculate#
The button sits at the foot of the left rail and is always there. While something is missing it is grey, and the line beside it says what: Pick a subject first. or Pick an LCIA indicator first.
While it runs, a progress bar shows which subject is being calculated, with Cancel beside it. When it is done, the line under the button says Computed in … s. How to read and export what comes out is the topic of Compare results.
The second tab, Decomposition tree, calculates one subject with one indicator, but breaks the score down along the supply chain. That is where you find out why a number is high: see Find the hotspots. The third tab, Sensitivity analysis, shows which parameters move the result and how far: see Test how sensitive the result is.
What happens behind the scenes#
You do not need this to work with PrismLCA, but it helps to understand the waiting times.
PrismLCA calculates with Brightway 2.5, the established open-source LCA engine, which runs locally on your computer. When you press Calculate, three steps happen:
- The model becomes a set of tables. Every process in your model and in the background database is a column; every product it makes or uses is a row. A second table lists the emissions and resources of each process, and the indicator adds a third with one factor per elementary flow. Mathematicians call these tables matrices.
- The supply chain is solved. One unit of your product needs so much of each input, each input needs its own inputs, and so on through tens of thousands of background datasets. Brightway solves this as one system of linear equations instead of following each chain by hand.
- Emissions become impacts. The total emissions and resource uses are multiplied by the indicator's factors and added up to one score.
Nothing of this leaves your computer. The calculation uses only your local databases.
How long it takes#
A single indicator for a model on ecoinvent or BAFU usually takes seconds. What makes it slower:
- The first calculation after a change. Step 1 and the hard part of step 2 depend only on the model, not on the indicator. PrismLCA keeps them in memory, so a second indicator or a second subject from the same model is much faster. Every edit to the model or its parameters starts this preparation over.
- Scenarios. Each scenario changes parameters, so PrismLCA prepares the model once per scenario.
- Breakdowns. Stacked bars on the Results page and the contribution tree trace the result back through the supply chain. They take longer than a plain score, more so with many subjects and indicators.
The canvas result bar and the Results page both tell you how many seconds a run took, so you learn quickly what to expect from your own models.