HandbookReports
Make a short report
The short report is a typeset PDF of where your model stands right now: goal and scope, results, charts, hotspots and the inventory, built entirely from the calculation. It needs no AI and no API key, and it takes a minute.
Short or full report?#
Both reports come from the same typesetting engine, with the same themes and languages. They differ in what they are:
| Short report | Full report | |
|---|---|---|
| Tab on the Report page | Short reports (w/o AI) | Full reports (AI) |
| Prose | None. Every chapter is built from the model's data. | Summary, conclusions, comments — written by the assistant or by you. |
| Stored | No. Only your settings are remembered. | Yes, with the model; re-render it at any time. |
| Review | Nothing to release. | Every AI chapter waits for your release. |
| Good for | A quick look, an internal update, a check before you write. | The study you hand to a client, a reviewer or the public. |
Nothing a model produced is printed in a short report — not even sources the assistant researched or the findings of its reviews. What you see is your model, your parameters and the calculated results. The settings of the two tabs are separate: nothing you pick here changes a full report.
Set it up#
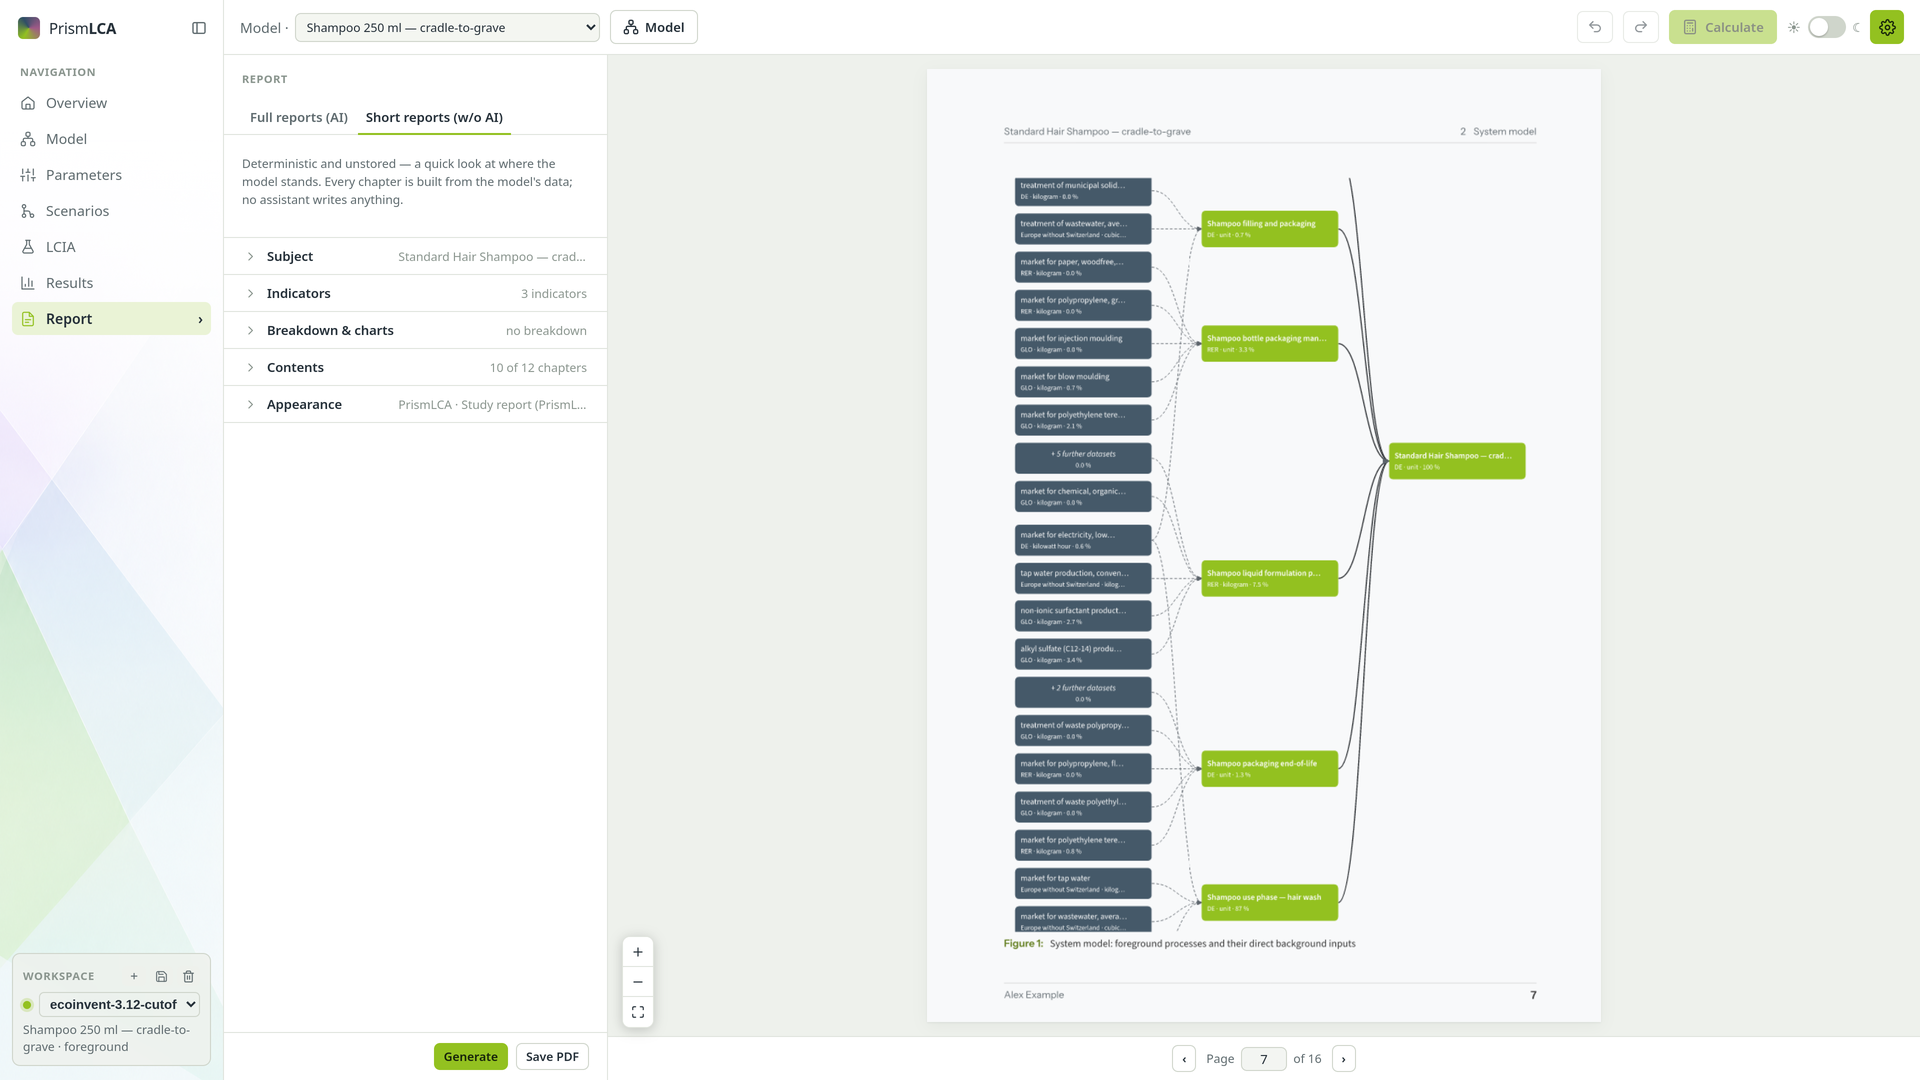
Open Report in the sidebar and choose the tab Short reports (w/o AI). The rail has six groups; one is open at a time, and each says what it holds while closed.
Title & language#
- Title and subtitle — printed on the cover. Left empty, the cover is titled after the reference process. Both are kept per model, so another model's short report starts with its own.
- Language — English, German, French, Spanish or Portuguese. Headings, tables and number formats follow it.
Subject#
- Reference process — the product or service the report is about.
- Amount (functional unit) — how much of it. Every absolute figure scales with this.
- Compare with — tick scenarios to add them as variants beside the reference. The list appears when the model has scenarios.
Indicators#
Pick at least one impact indicator under + Add indicator. The picker shows one method family at a time, starting with the one you have picked from; Done folds it away, and what you picked stays listed as chips, each with its own ×.
Breakdown & charts#
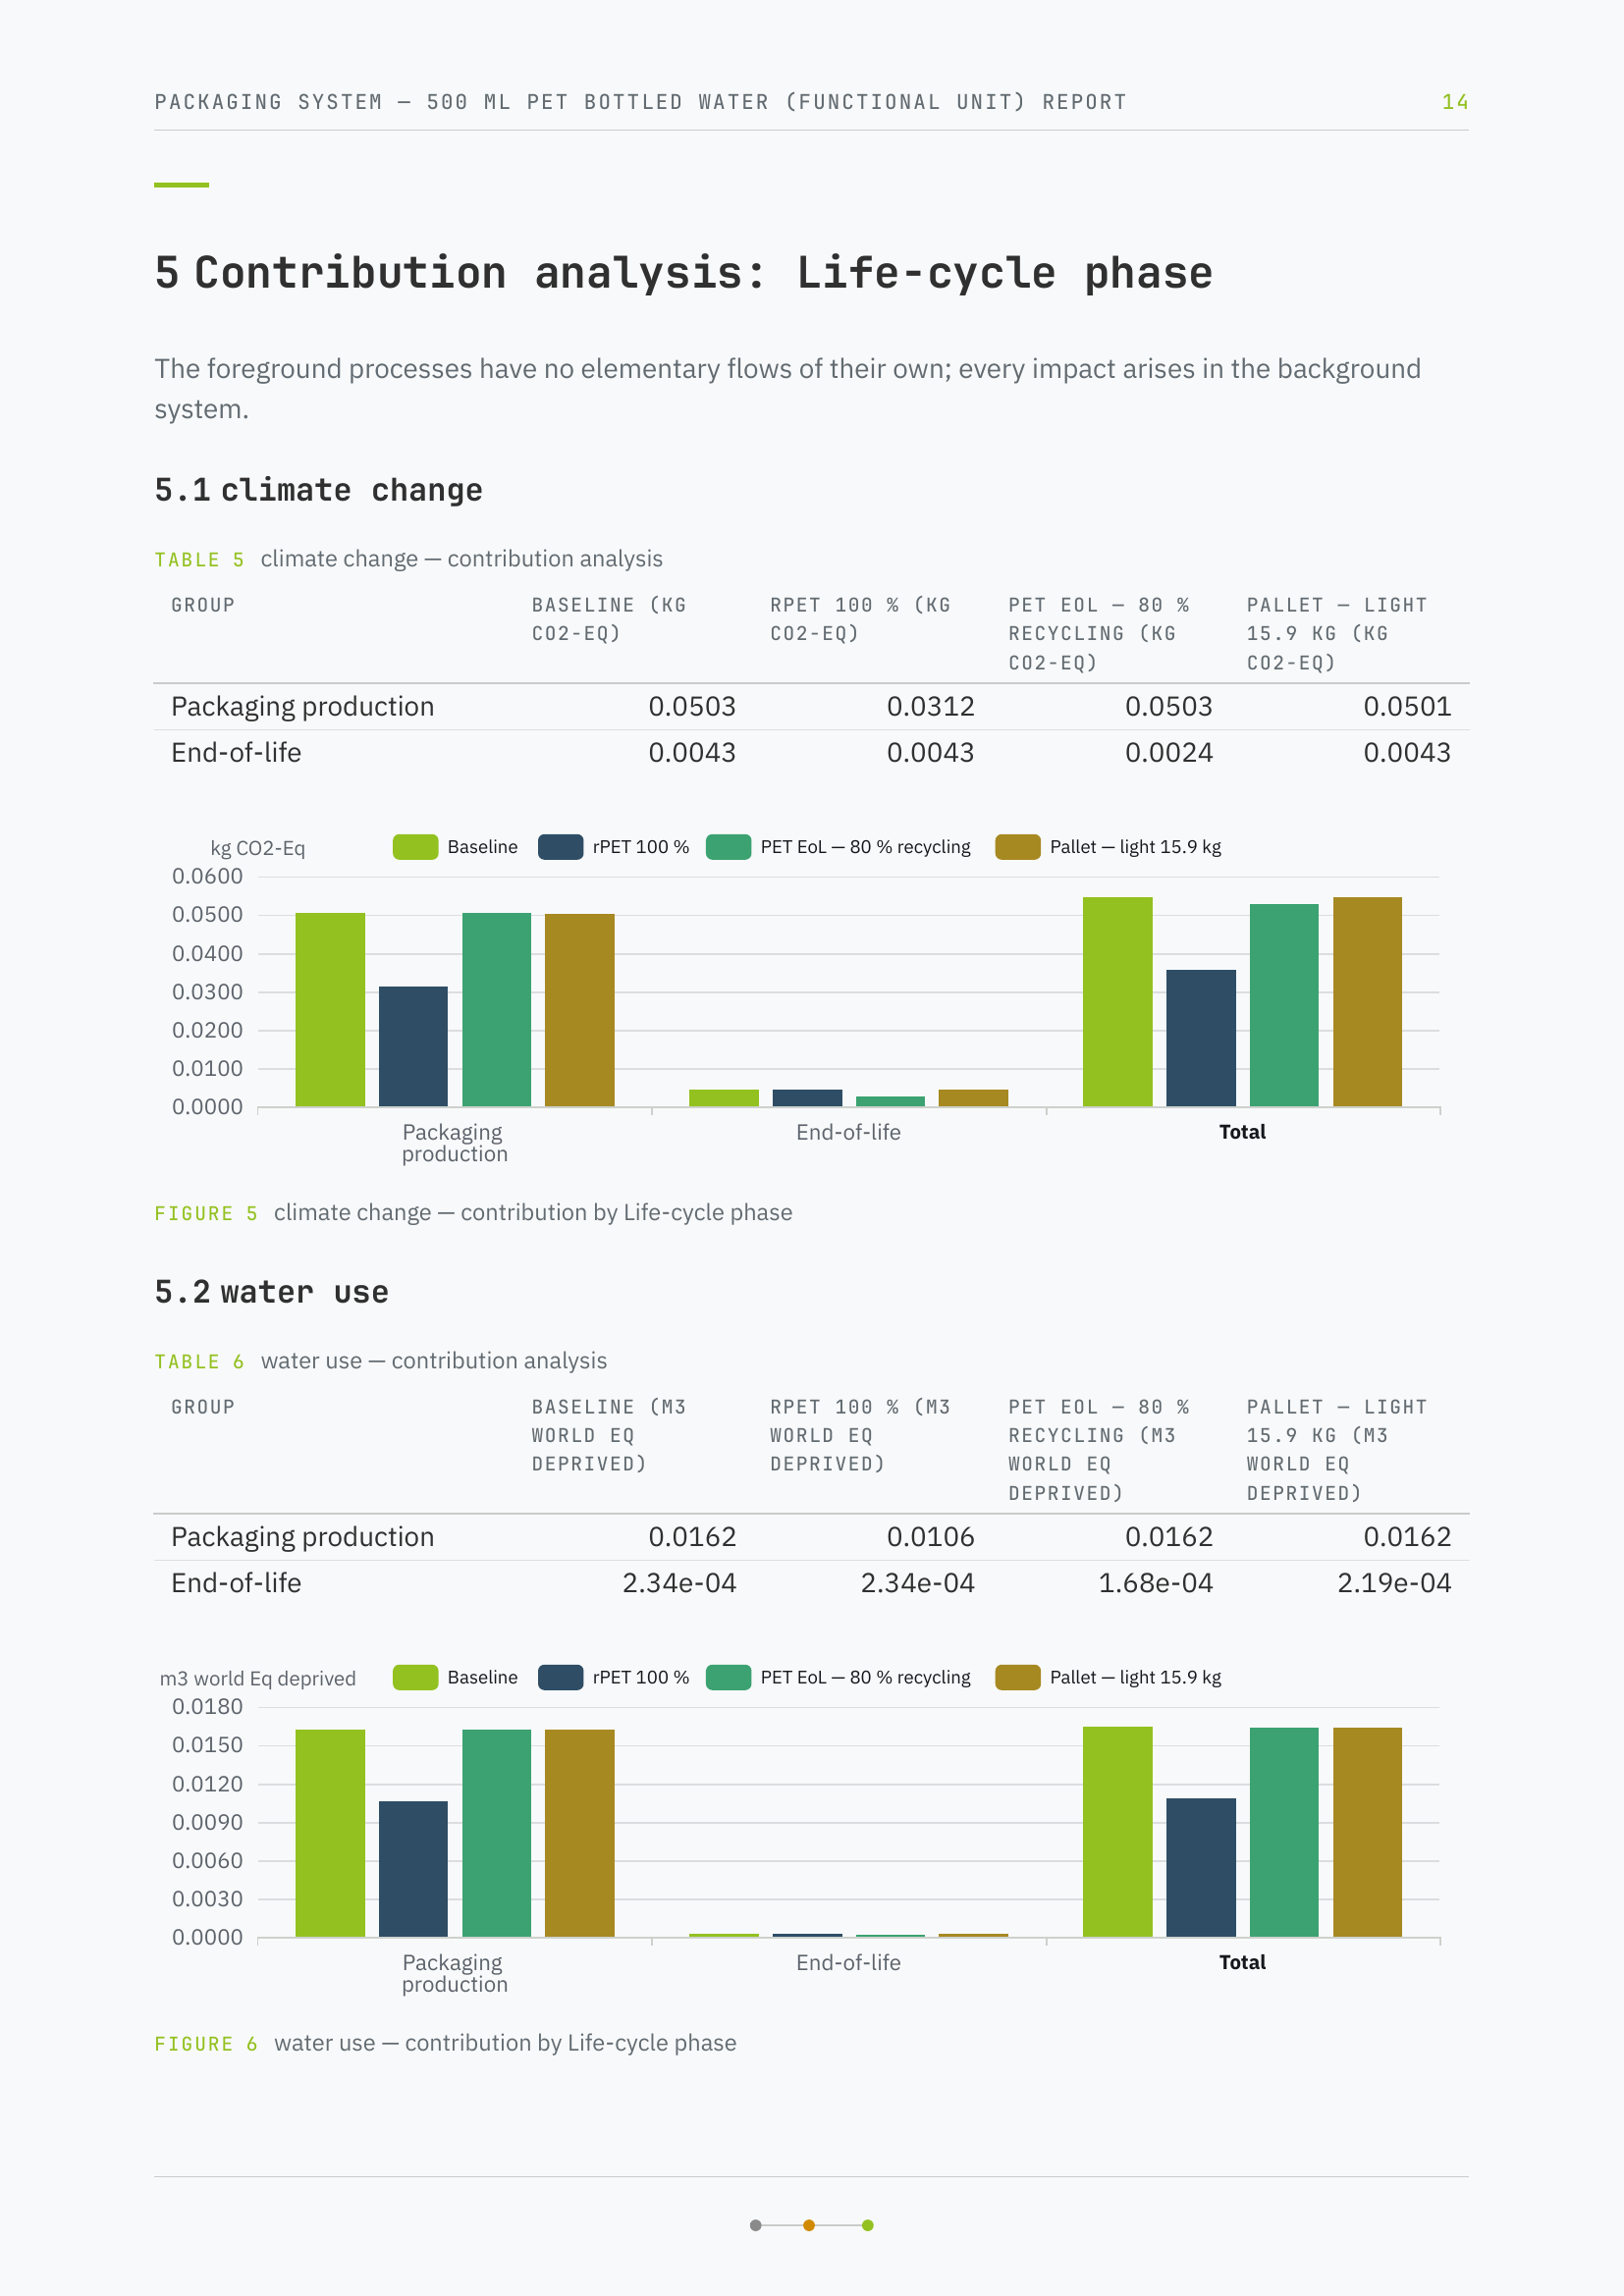
- Break the contribution down by — tick one or more of your tag groups, such as life-cycle phase. Without tags there is nothing to tick.
- Contribution chart — Grouped or Stacked. Stacking needs a second variant.
- Per-indicator charts — All, Lead or None: how many indicators get a bar chart of their own. They compare variants, so they need a second one.
- Heatmap of every indicator — every indicator side by side, each cell as a share of the highest value in its row. Needs a second variant.
- Radar across the indicators — one closed line per variant. Needs a second variant and more than three indicators.
- Hotspot tables — under each breakdown, the background datasets with the largest direct contribution. Needs a breakdown.
- Parameter sensitivity (tornado) — a tornado in the Interpretation checks chapter, under the sensitivity check: each parameter of the reference process moved on its own from the baseline, one figure per indicator you tick, over ±10 %, ±25 %, ±50 % or a Custom range. Needs the Interpretation checks chapter under Contents.
Contents#
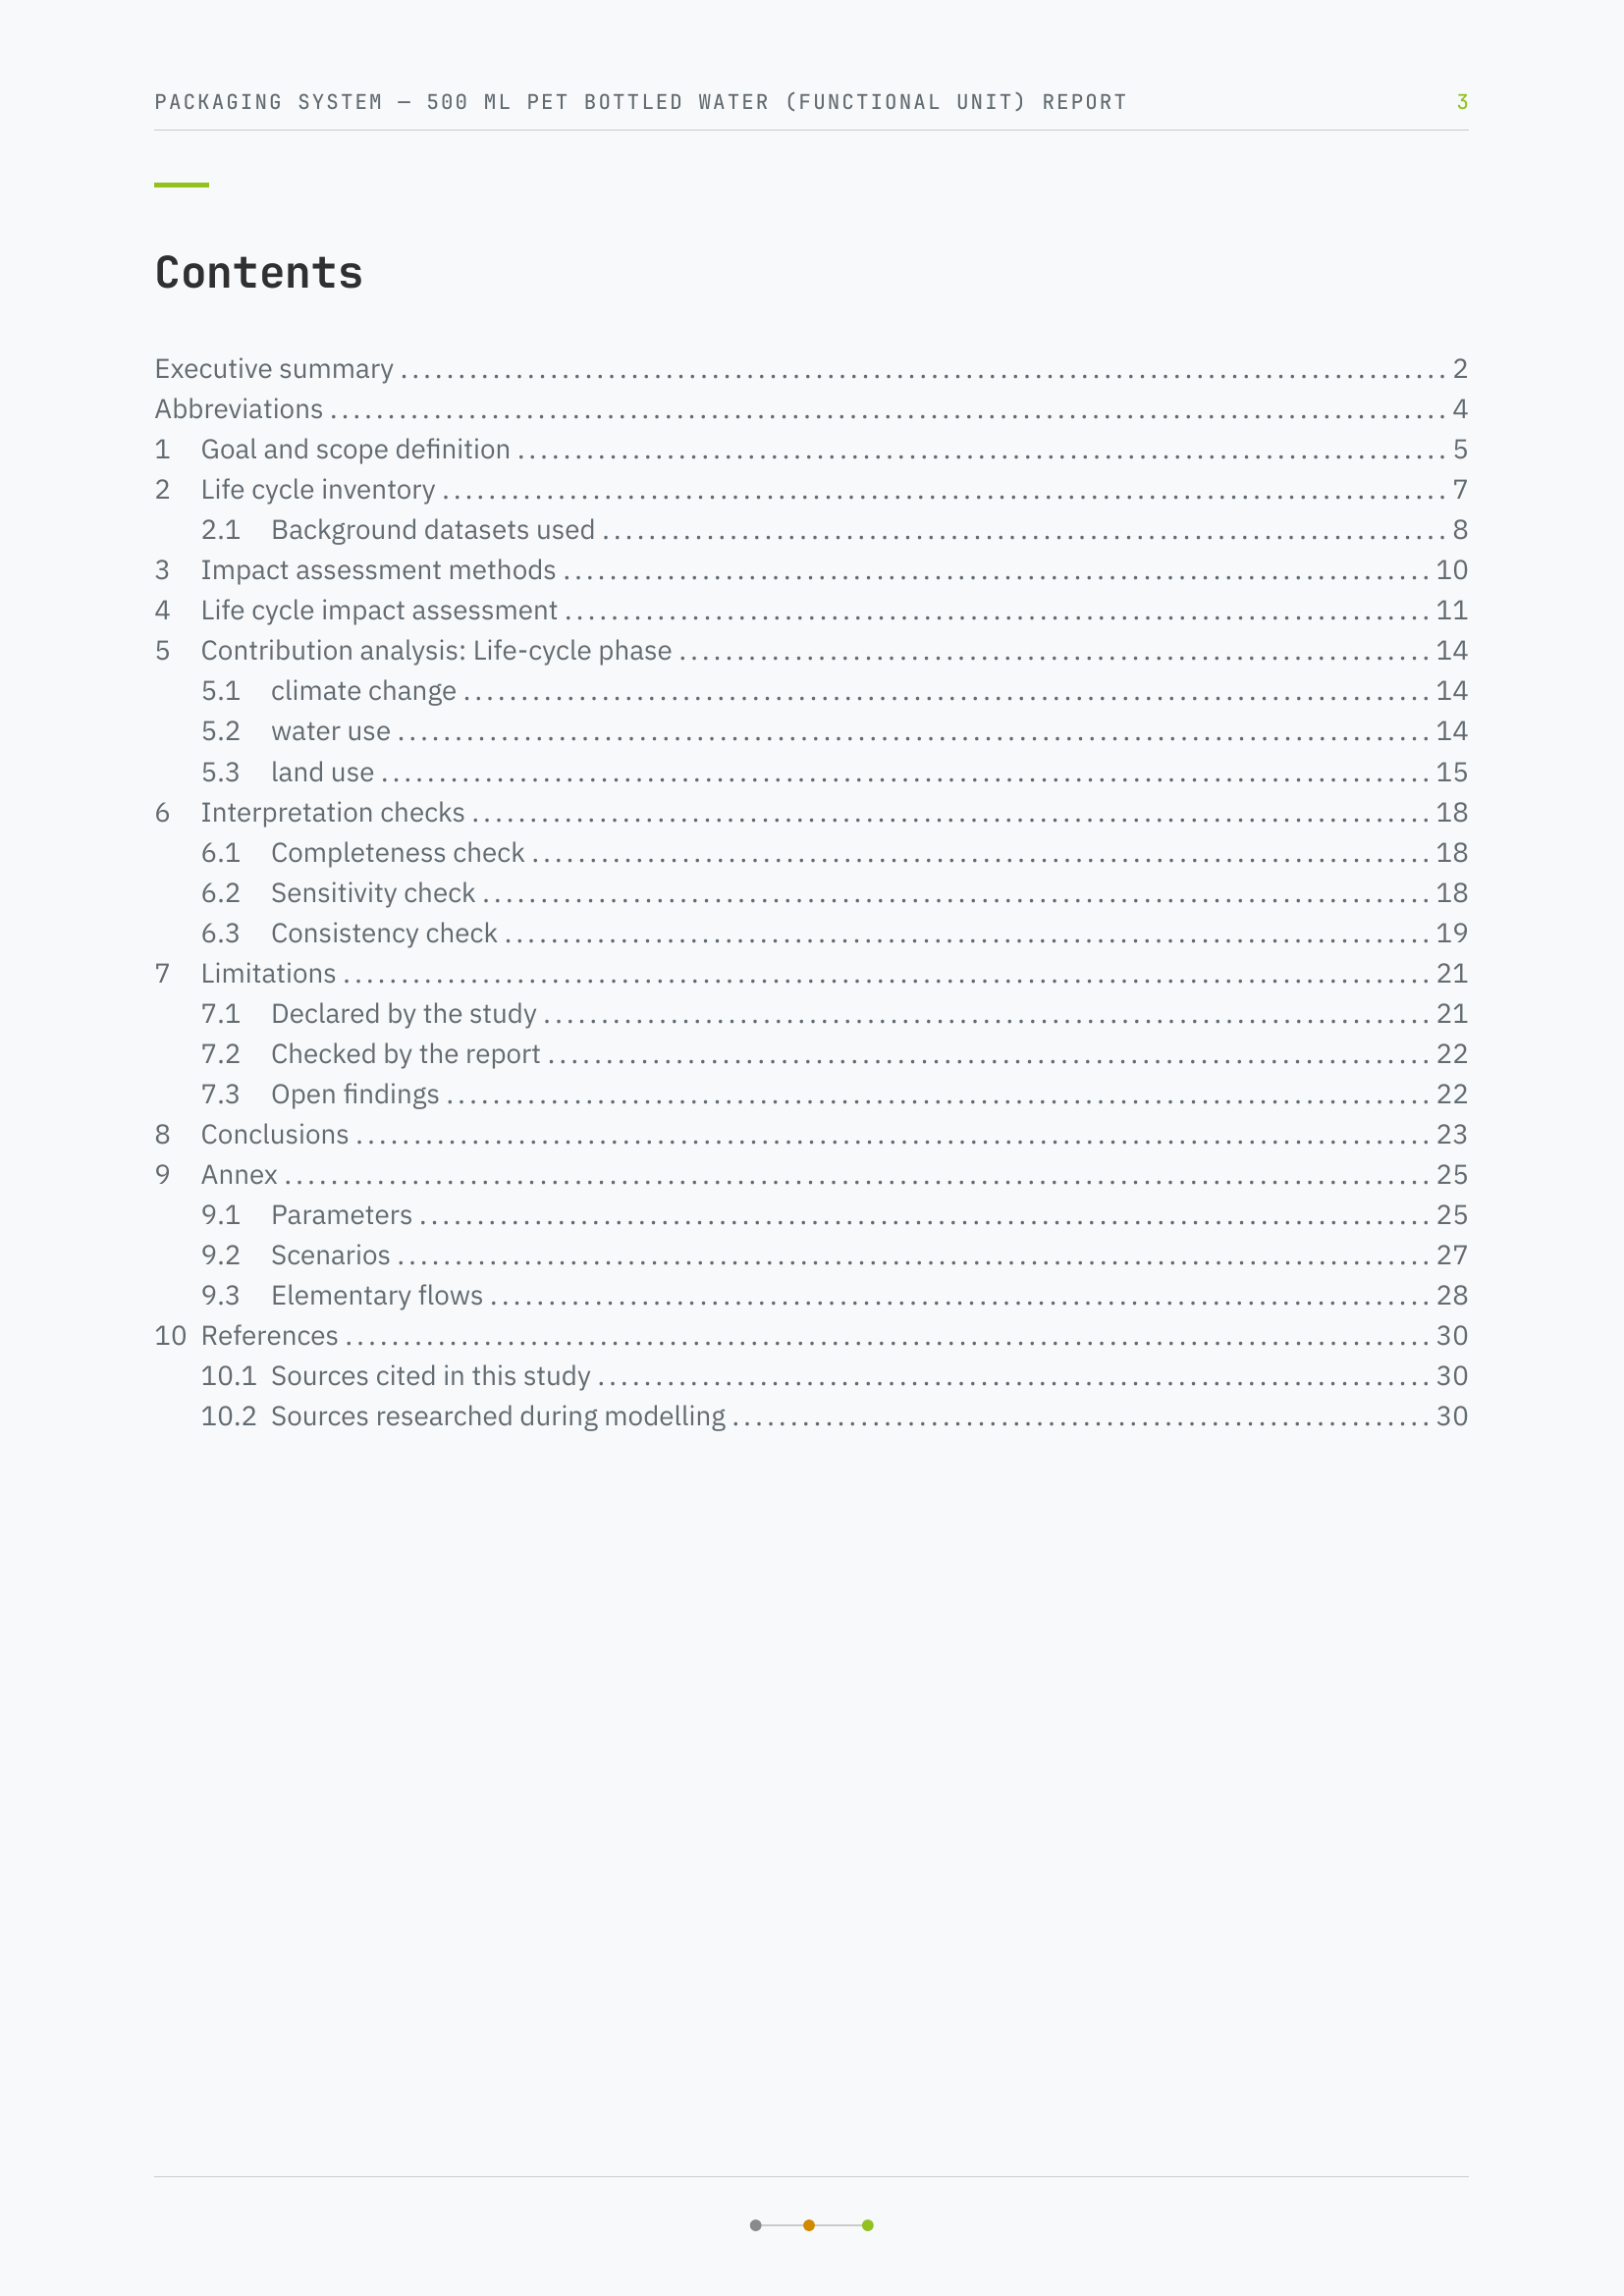
Tick the chapters the report should carry. All are on by default except Background datasets:
- Goal & scope — the study metadata from the model info.
- System model — the process graph: your processes and their direct background inputs.
- Life cycle inventory — the processes and the datasets they link to.
- Methods — which indicators, from which method family.
- Results — the results table and charts.
- Contribution — needs a breakdown under Breakdown & charts.
- Interpretation checks — completeness, sensitivity, consistency (ISO 14044 §4.5).
- Limitations — what the study declares, and what the report can check is absent.
- Background datasets — a chapter of its own for the datasets table; the inventory then keeps only the processes.
- Annex — parameters, scenarios and the largest elementary flows.
- References
- Reproducibility — versions and model state.
With System model ticked, System model figure sets how the graph is drawn: First background tier, Amounts on the links, Datasets per process (the rest fold into one node) and Colour processes by (accent colour, share of the leading indicator, or a tag group).
There is no abbreviations chapter: explaining acronyms takes a language model, and this report uses none.
Appearance#
Colours and Theme work exactly as in the full report — see Languages, themes and PDF.
Generate and save#
Generate#
Click Generate at the foot of the rail. PrismLCA calculates what the report needs and typesets it; the pages appear in the preview beside the rail.
Page through the preview#
The preview comes from the same renderer as the PDF, so what you see is what you get. Change a setting and click Generate again.
Save PDF#
Save PDF typesets the document and saves it. The pane says where the file went.
See also: The full study report · Find the hotspots