HandbookResults
Find the hotspots
A score alone does not tell you what to change. This page shows how to break one result down along the supply chain and into the emissions behind it, and how to get from a hotspot back to the process in your model.
Open the Decomposition tree#
Open Results in the sidebar and switch to the second tab, Decomposition tree. Where the first tab, Results, puts many subjects side by side, this tab takes one subject and one indicator and shows where the score comes from. The rail on the left has three groups.
Subject#
- Your models — pick one process with the round button. The tab opens on the model's reference process; add others with + Add from this model, and take one off the list again with ×.
- Variants — shown when the model has scenarios. Tick Baseline, one or more scenarios, or both (see Compare variants below).
- From a database — + Add from database picks a background dataset as the subject. Useful to see what drives a dataset before you rely on it.
Impact category#
Choose a Method family and an Indicator. ★ marks the recommended indicator of its category; see Impact methods.
Calculation#
- Breakdown by elementary flows
- Shows the elementary flows panel beside the tree (on by default). See Which emissions below.
- Cutoff (%)
- Hides branches below this share of the total. The default is 0.5 %. Lower it to see more of the long tail; raise it when the tree is too busy.
- Max depth
- How many tiers of the supply chain are traced, from 1 to 20. The default is 8.
- Group by
- One of your tag groups, such as life-cycle phase, or — off —. Only tag groups used in the subject's model are offered.
Press Calculate at the foot of the rail. While the tree is computed, the line under the button names the subject, with Cancel beside it. Afterwards the score appears in the Calculation group, and the line says how long it took. Change a setting later and the line reads Settings changed — the shown tree is outdated. until you press Calculate again.
Read the contribution tree#
The tree starts with your subject on the left and branches out to the right into everything that contributes to its score.
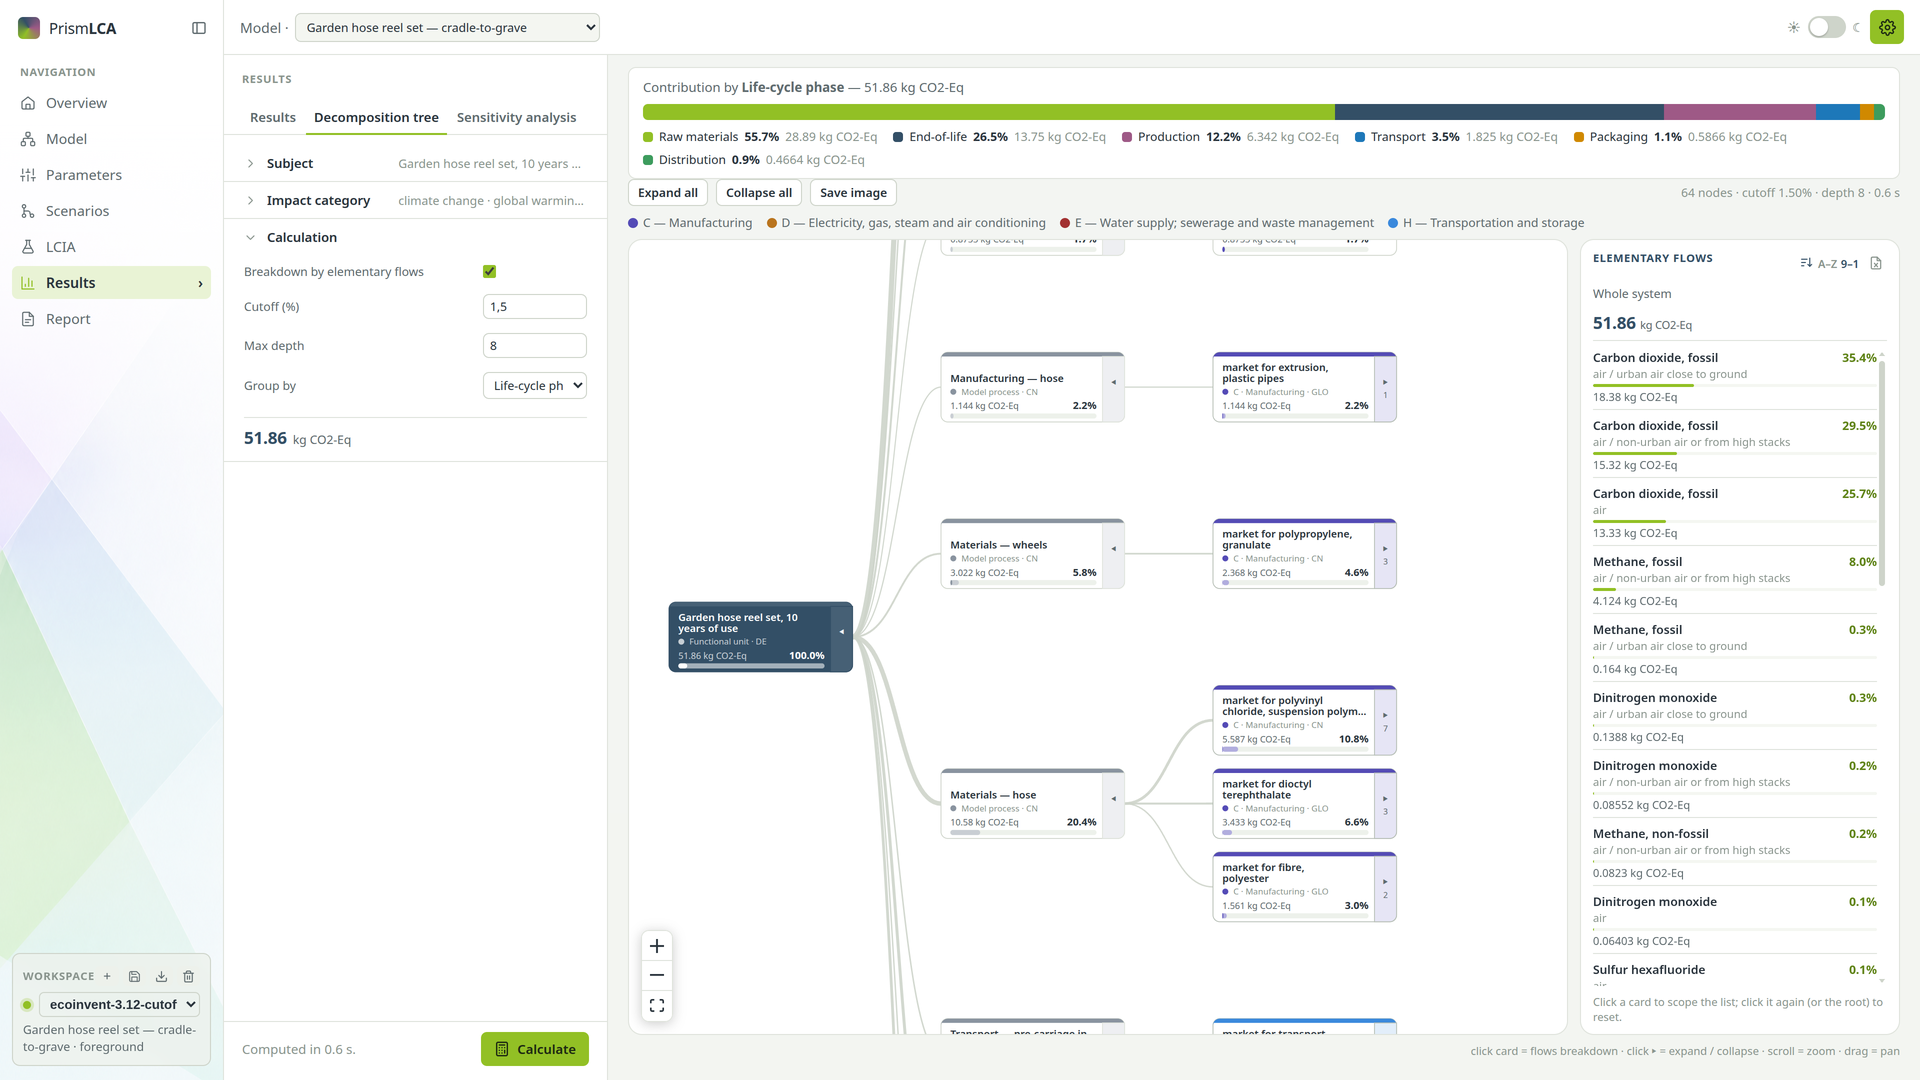
Each card shows:
- the process name and a line with its sector (ISIC) and region; a coloured strip on top marks the sector, explained in the legend above the tree;
- its value in the indicator's unit and its share of the total in percent;
- a bar in two shades: the pale part is what the whole branch carries, the solid part what this process emits itself.
Hover a card for the details: geography, ISIC and CPC class, amount, Share of total, Share of parent, Cumulative (the branch) and Direct (the process alone).
Move around#
- Click ▸ on the right edge of a card to fold out its suppliers, ◂ to fold them away. A number under the arrow says how many are folded.
- Expand all and Collapse all above the tree open or close every branch at once.
- Scroll to zoom, drag to pan. The buttons in the corner zoom in, zoom out and Fit to view.
- Save image writes the tree as a PNG — exactly as it is folded, so open what you want shown first.
The line above the tree tells you how many nodes it has and which cutoff and depth produced it. If a process you expect is missing, it is probably below the cutoff or deeper than Max depth.
Group by life-cycle phase#
With Group by set to a tag group, a bar above the tree shows the contribution of each value — for example raw materials, production, distribution and end of life — with its share in percent and its value. This is usually the first thing to look at: it tells you which phase to examine in the tree. Background datasets count towards the phase of the process that uses them; processes of your own without a tag in that group are collected as (untagged). How to tag processes is explained in Life-cycle phases and tags.
Compare variants#
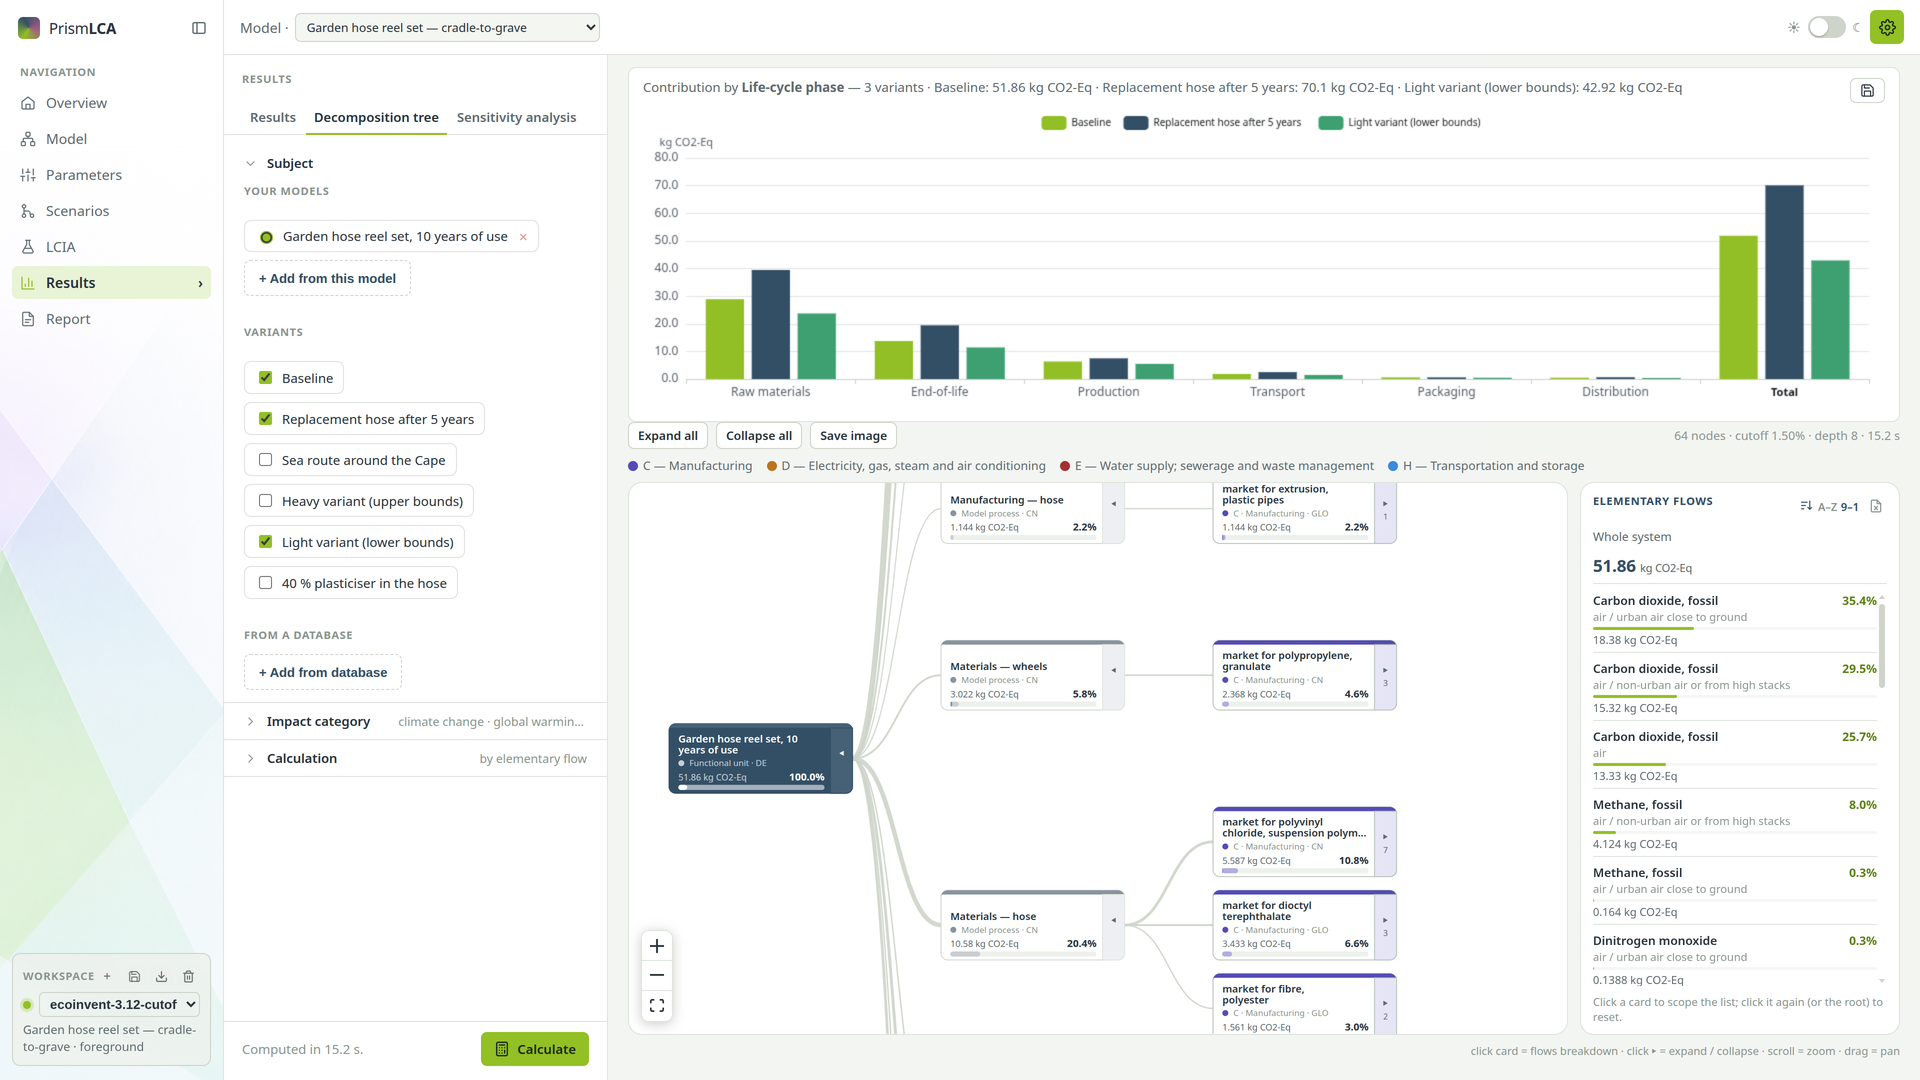
Under Variants, tick the baseline and as many scenarios as you like. The tree shows the first ticked variant; from the second on, the area above the tree becomes grouped bars, one bar per variant within each group, so you see in which phase the scenarios differ. Without Group by, the bars compare the variants' totals. While a scenario is in use, a chip Scenario: … next to Calculate reminds you that the tree reflects its parameter values.
Which emissions: the elementary flows#
The tree answers which process; the elementary flows answer which substance — carbon dioxide, methane, sulphur dioxide, a resource taken from nature. With Breakdown by elementary flows on, the panel Elementary flows sits to the right of the tree.
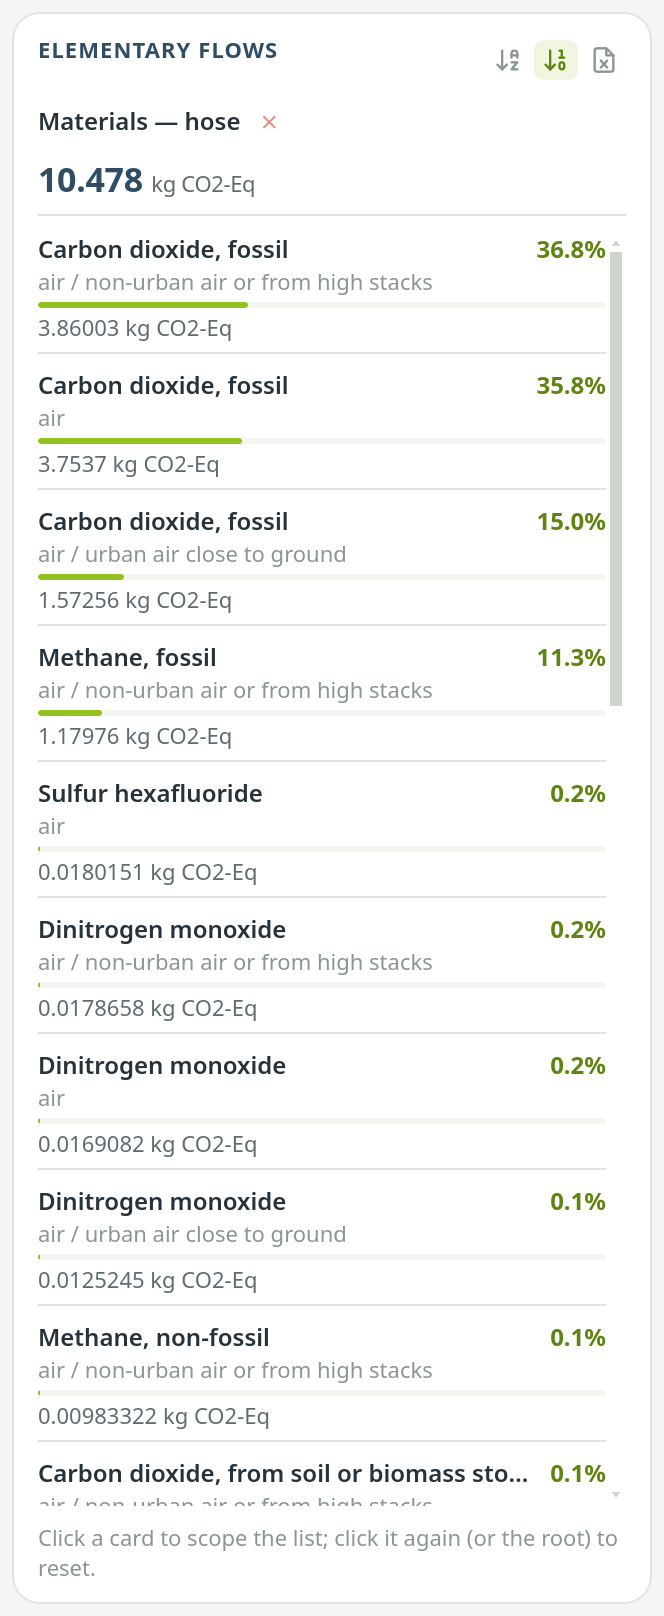
- At first it covers the Whole system. Click a card in the tree to narrow the list to that process and everything below it; click it again, the root, or × beside the name to go back to the whole system.
- Each row shows the flow, its compartment (such as air / urban), its share and its value.
- The two sort buttons order the list by name or by impact.
- The list shows the 25 largest flows. The number above the list is the whole score, so these rows do not add up to it; Show all … at the foot loads every flow.
- The Excel button exports the list — always with all flows, whatever the panel shows.
From a hotspot back to the model#
Once you know what drives the score, go back and check it. Three ways lead there:
Your own processes: the canvas#
Hotspots that are processes of your model are edited on the Model page. Open Model in the sidebar, select the subject and press Calculate in the toolbar: every process box then shows its share, so the hotspot from the tree is easy to find. Check its amounts, the dataset it is linked to and the parameters behind it. See Calculate.
Background datasets: the details window#
Cards of background datasets carry a small i (Process details). It opens the dataset's documentation — the same window as in the model search. Read it before you decide that a dataset is the wrong choice; if it is, find a better one with Find the right dataset.
Let the assistant point the way#
The assistant can explain a result and names the processes it talks about. Process names in its answer are links: click one to jump to that process on the canvas.
Explain the climate result of the hose reel. Which three processes contribute most, and which emissions are behind them? Link the processes so I can check them.
See also: Check, undo and the audit log