HandbookResults
Compare results
On the Results page you put products, variants and scenarios side by side across as many impact indicators as you like, read them as a table and charts, and take the charts and numbers out to Excel or a presentation.
The page at a glance#
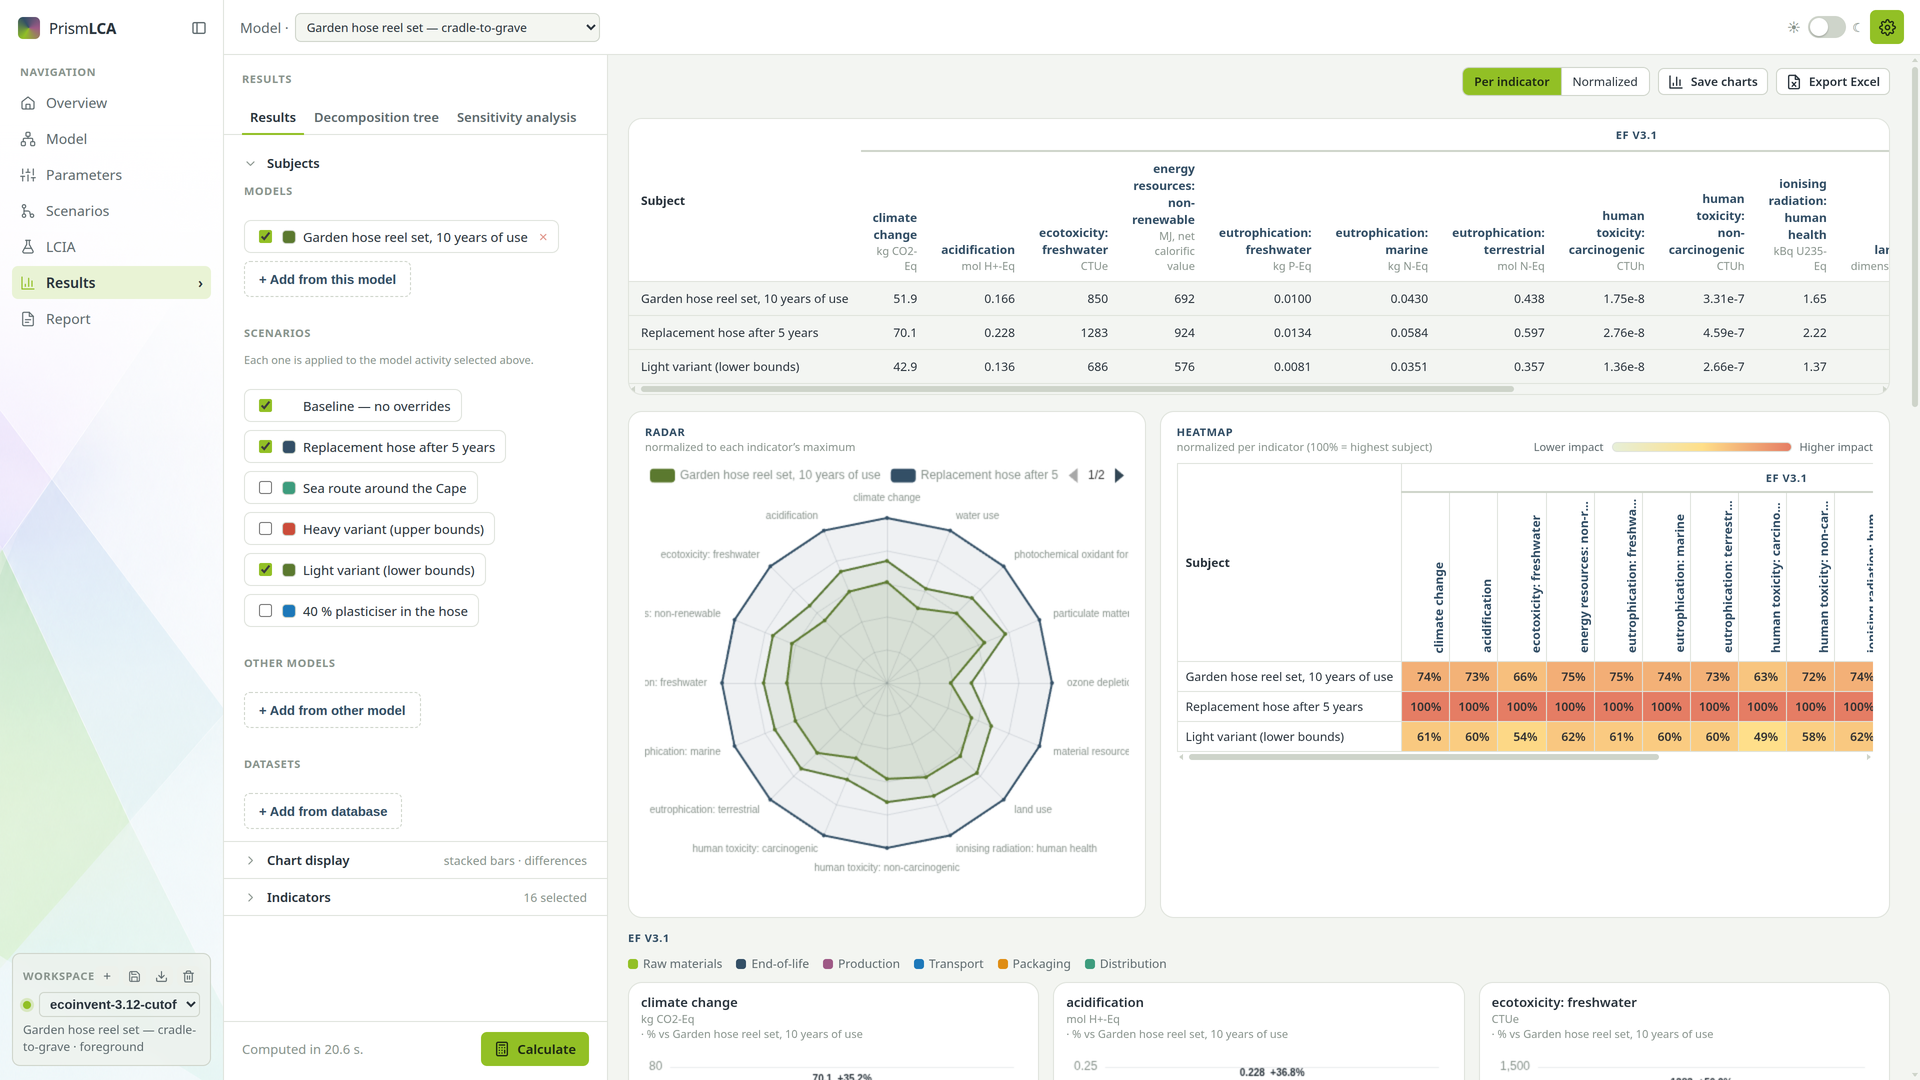
Open Results in the sidebar and stay on its first tab, also called Results. The left rail holds your choices, the rest of the window the results:
- Subjects — what you compare.
- Chart display — how the charts are drawn.
- Indicators — what you measure.
- Calculate, pinned at the foot of the rail.
The three groups are an accordion: one is open at a time, and each says what it holds while it is closed, such as 3 selected. Every model keeps its own subjects, colours and reference, so opening another study does not bring the last one's choices with it; the chart display options apply to all models. Indicators are the exception: a model you open for the first time starts with the set you used last.
Choose the subjects#
A subject is one thing you calculate — a product, a variant of it, or a dataset from a database (see the glossary). Subjects has four kinds:
- Models
- Processes of the model you are working on. The page opens on the model's reference process — the one no other process consumes, or the one behind the Reference quantity if you set one — and nothing else, because comparing a reel with its own hose is rarely what you want. Add other processes with + Add from this model.
- Scenarios
- Shown when the model has scenarios. Each ticked scenario is applied to the model processes selected above. Baseline — no overrides is the model as it stands; untick it to see a scenario on its own.
- Other models
- Processes from other models in the same workspace, through + Add from other model. This is how you compare two designs that live in separate models.
- Datasets
- Datasets straight from a background database or your library, through + Add from database. It opens the same search as the Model page; you can set the amount before you add a dataset. Useful as a benchmark — your reel against a generic plastic product, for example.
Every subject has a checkbox to leave it out of the next run without losing it, a colour swatch that sets its colour in all charts, and × to remove it.
Choose the indicators#
Under Indicators, choose + Add indicator. A picker opens in three columns, on the family of the indicators you have already picked:
- the method families on the left;
- the indicators of the chosen family in the middle, with Filter indicators… above them and Select all / Deselect all, which act on the indicators the filter shows;
- a short description of the family on the right, with a Method reference ↗ link where there is one.
Click an indicator to add or remove it. ★ marks the standard reporting indicator of its category. Choose Done to close the picker; the selected indicators stay as chips grouped by family, each with its own ×. Which method to pick is explained in Impact methods.
Then press Calculate. Calculate explains the progress bar, Cancel and why results do not refresh by themselves.
Read the results#
The results appear from top to bottom:
- Table
- One row per subject, one column per indicator, grouped by family with the unit under each name. Click a column header to sort by it, or Subject to sort by name. Double-click a result to copy it: the full, unrounded value goes to the clipboard, with the decimal separator of your computer's regional format.
- Radar
- Shown from three indicators on. Every indicator is scaled to its own maximum, so the subject with the largest value touches the outer ring. It shows at a glance which subject is better on which indicator.
- Heatmap
- Subjects against indicators, coloured from Lower impact to Higher impact; 100 % is the highest subject of each indicator.
- Bar charts
- One chart per indicator, grouped by family, in the subjects' colours.
With more than one indicator, two buttons above the results switch the bar charts: Per indicator shows one chart each, in real units; Normalized draws all indicators in one chart, each as a percentage of its highest subject.
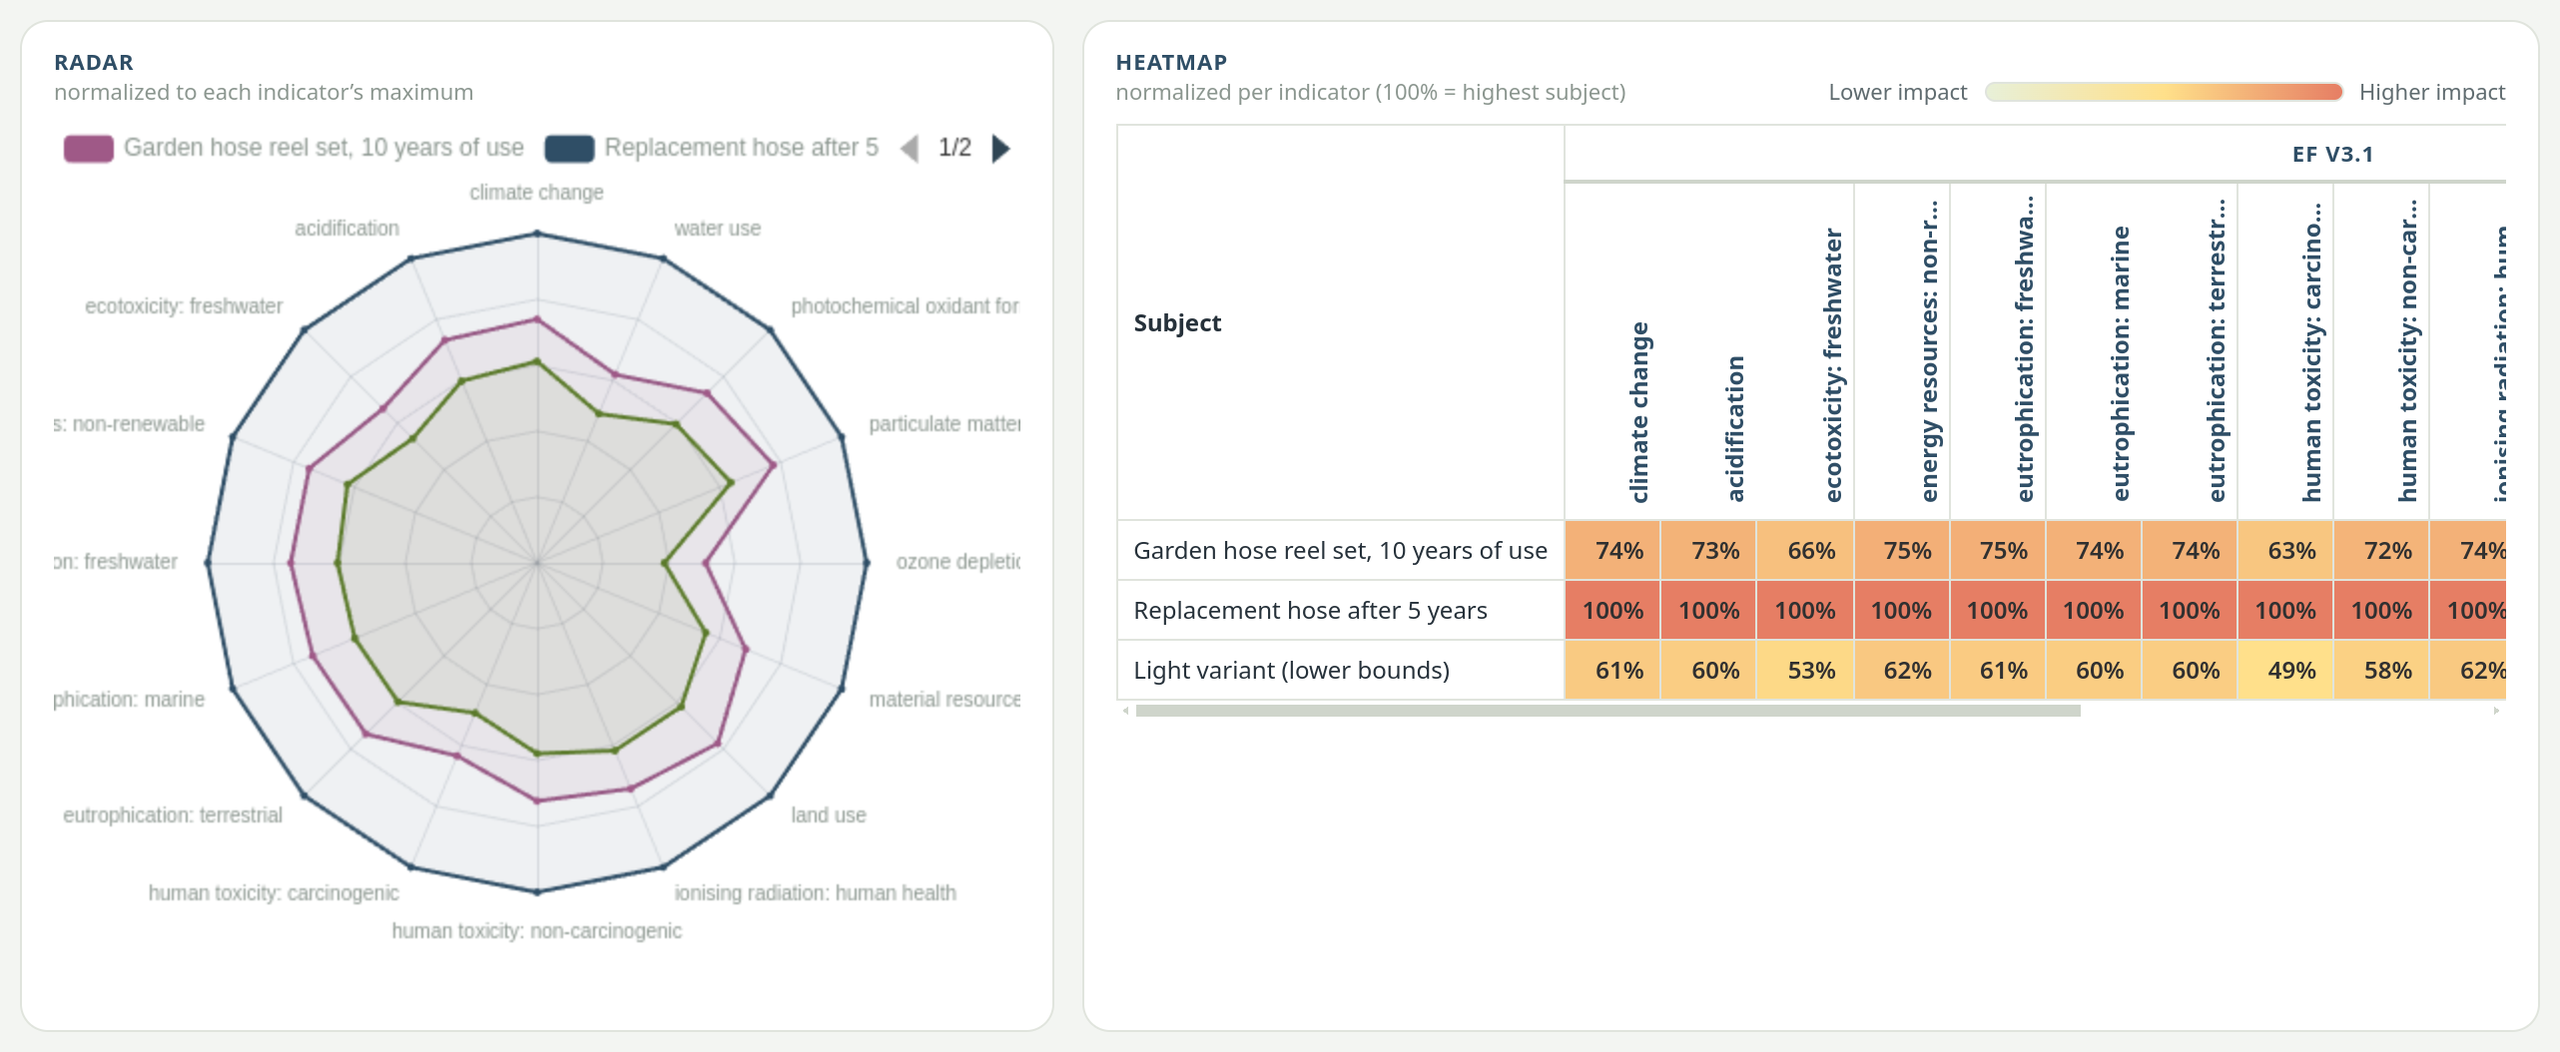
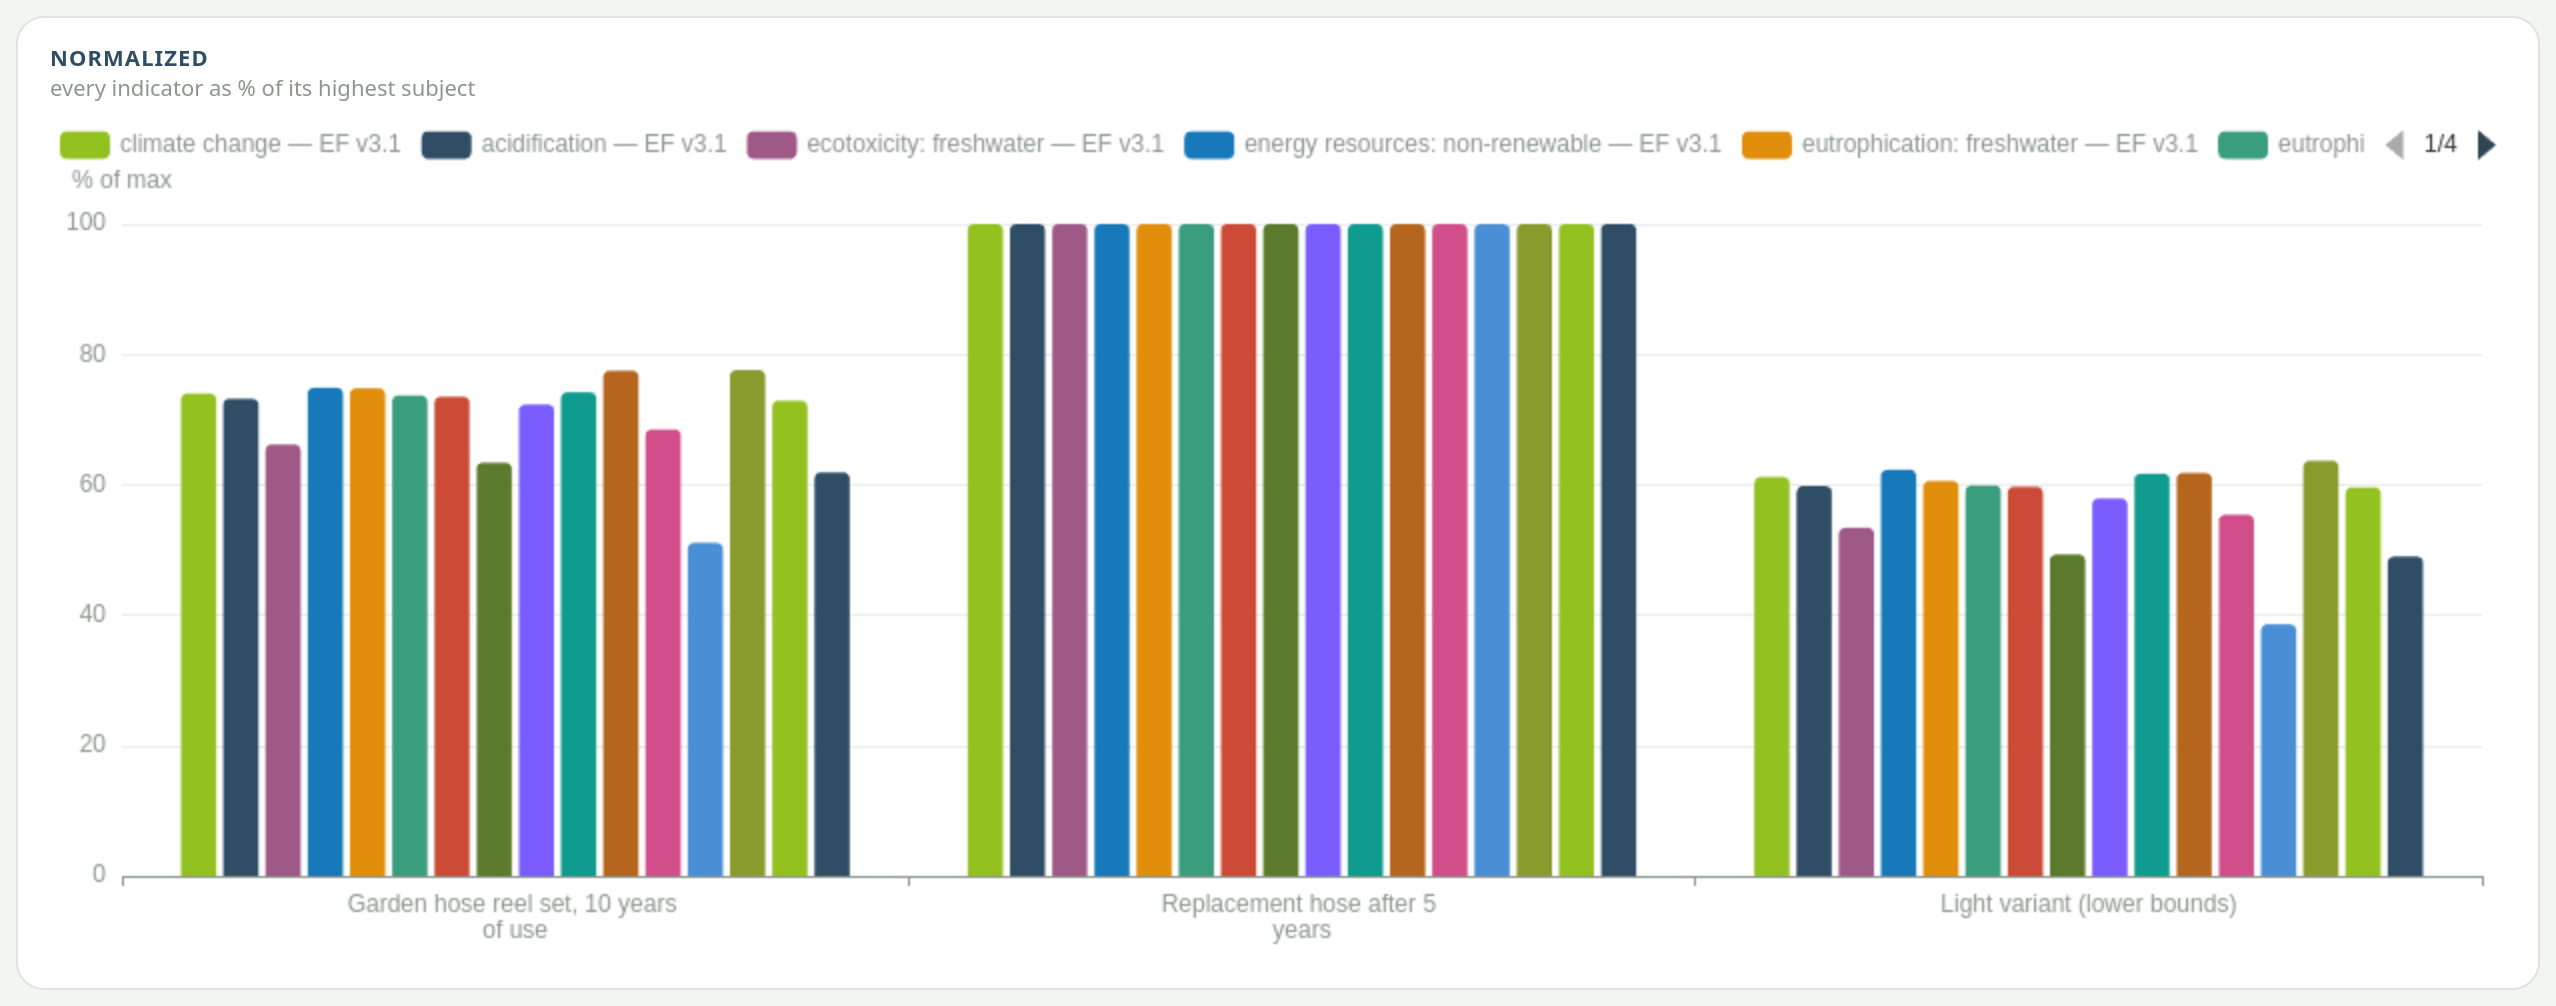
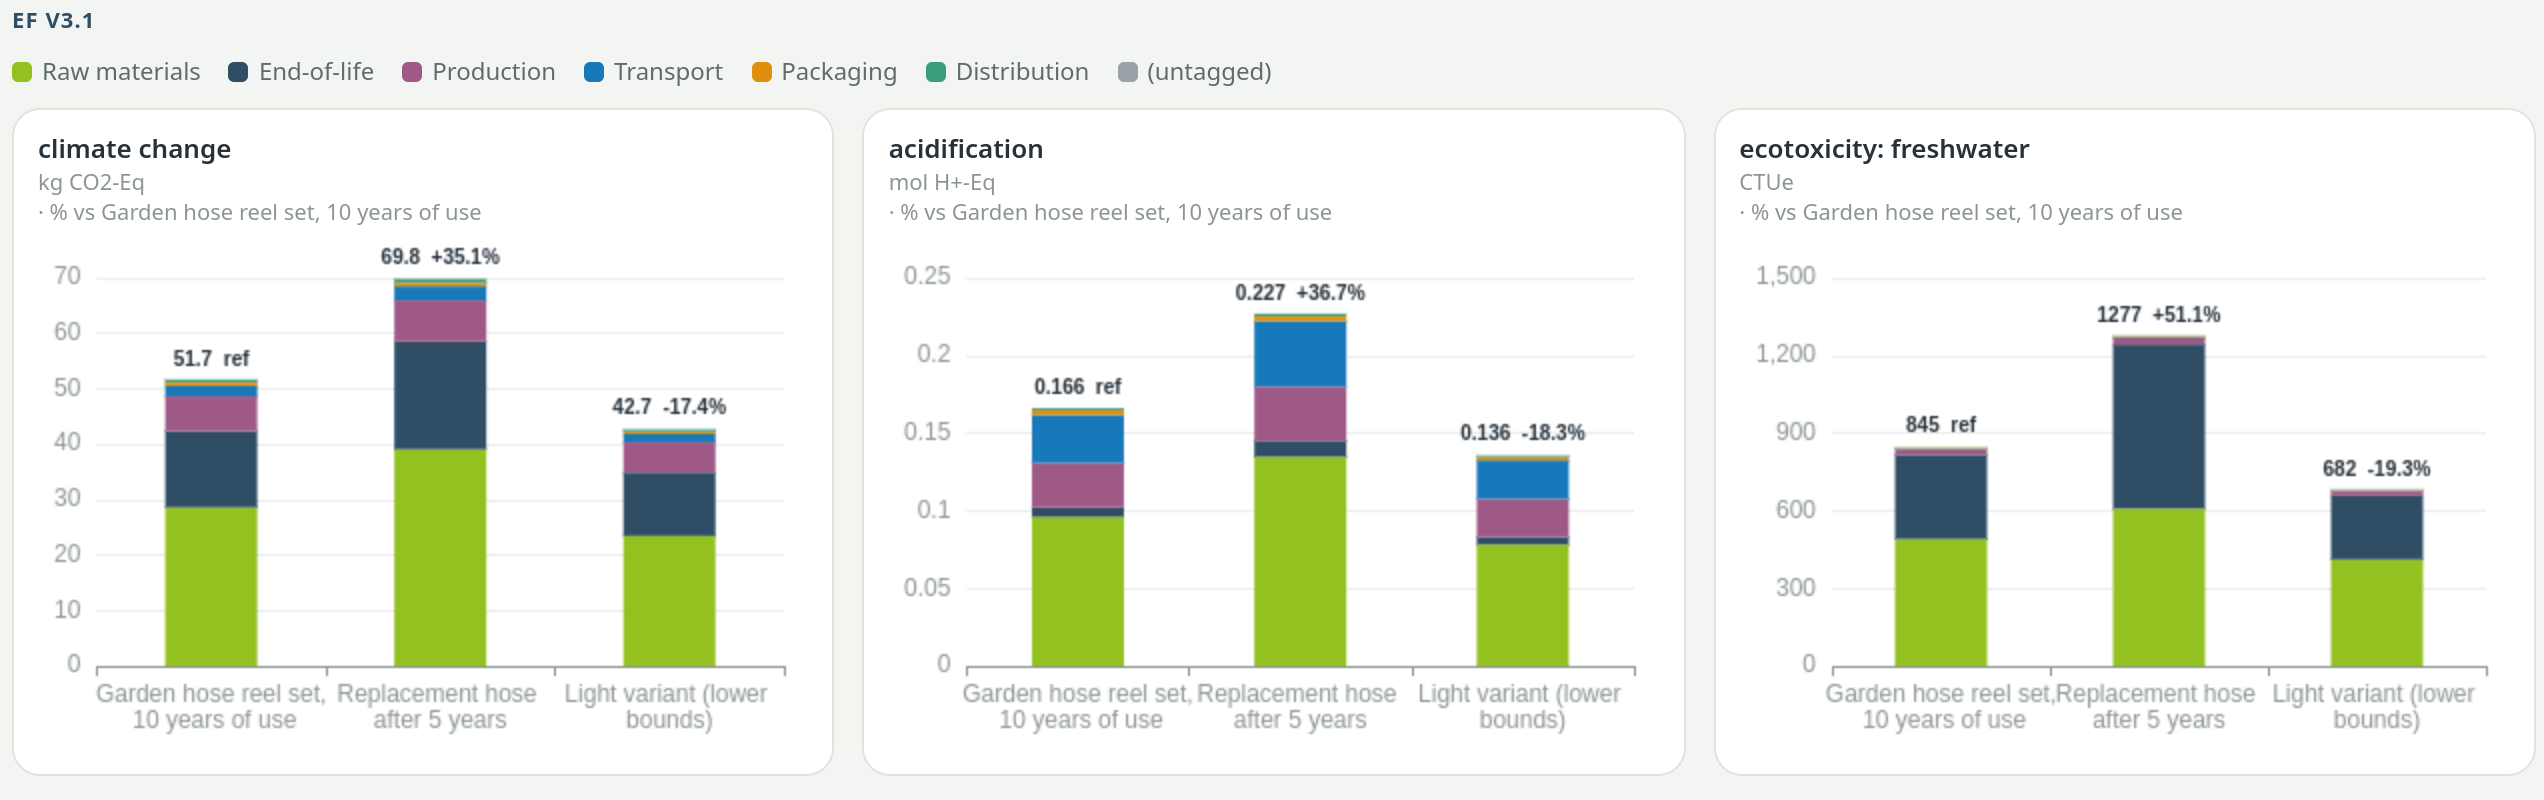
Chart display options#
Open Chart display in the rail.
- Show values on bars
- Prints the number on each bar.
- Decimals
- Auto or a fixed number from 0 to 8. Auto follows the largest value of each chart and switches to scientific notation below 0.0001.
- Difference to reference (%)
- Adds a percentage above each bar, measured against the subject you pick under Reference. The reference itself is labelled ref. The bars still show the absolute score.
- Stacked bars / disaggregated exports
- Splits every bar into parts. Under Split by, choose ISIC classification or CPC classification (the economic sector or product class of each contributing dataset), or one of your tag groups, shown as Tag: … — for example Tag: Life-cycle phase. Only tag groups used in your subjects' models are offered. As the name says, the switch also changes the Excel export (see below).
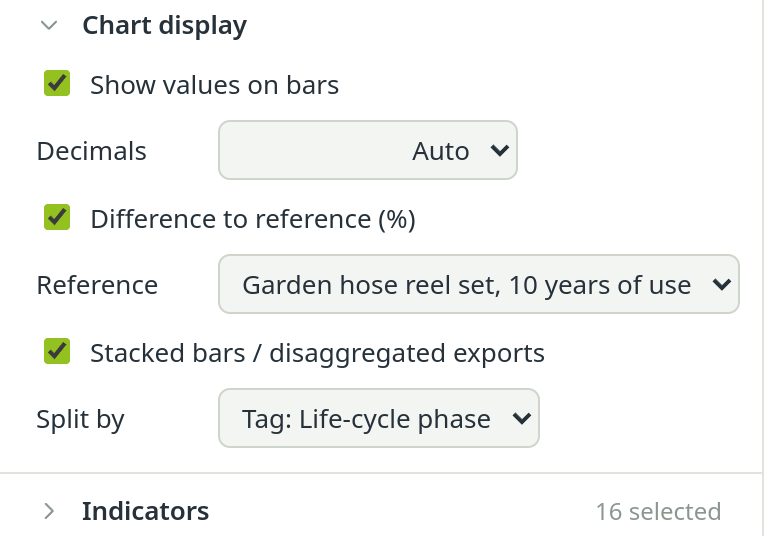
Stacked bars need an extra calculation: after switching them on, press Calculate again. Once they are computed, changing Split by is instant, because all splits are calculated in one pass.
Take the results out#
- Enlarge — the icon in the corner of every chart opens it full size.
- Save this chart as PNG — the save icon beside it downloads that one chart.
- Save charts — above the results. Asks for a folder once (Save here) and writes every chart currently shown into it as PNG: the bar charts (or the normalized chart), the radar and the heatmap. A file name that already exists gets a number instead of being overwritten. The line beside the button says how many charts went where.
- Export Excel — the table as a spreadsheet. With Stacked bars / disaggregated exports switched on and computed, it writes one row per part of each subject plus a Total row, with a column naming the part, so you can sort, filter and pivot it.
How to read a comparison honestly#
A chart makes any difference look meaningful. Before you draw a conclusion, check these points:
- The same function. Each model process is calculated for one unit of its reference product; a dataset for the amount you set. A reel compared with 1 kg of PVC is not a comparison of equals. Make sure the subjects deliver the same function.
- The same system boundary. If one model includes the end of life and the other stops at the factory gate, the difference is in the boundary, not in the product.
- More than one indicator. A design that wins on climate change can lose on water use or resource depletion. Look at the radar or the heatmap before you call one option better.
- Small differences. Background data and your own assumptions carry uncertainty. A difference of a few percent is usually not a robust result; say so, or test it with a scenario.
- The right indicator variant. Prefer the ★ indicators. A specialist variant, such as biogenic-only climate change, can be far off the total.
- The reason behind the number. Before you report a difference, find out where it comes from in Find the hotspots.
See also: The short report