HandbookResults
Test how sensitive the result is
Which of your assumptions carry the result, and which could be off by a wide margin without changing anything? The Sensitivity analysis tab answers that with two charts: a tornado that ranks the model's parameters by how far they move the result, and a curve that follows one parameter across a range.
The tab at a glance#
Open Results in the sidebar and switch to the third tab, Sensitivity analysis. It works on one subject of the open model — a process whose parameters you vary. The rail on the left has three groups:
- Subject — the process to calculate. PrismLCA starts with the process that no other process of the model consumes. Only processes of the open model are offered, because the parameters belong to it.
- Tornado — which parameters, how far each is moved, from which variant, on which indicators.
- Parameter curve — one parameter, its range, one indicator and the variants to draw.
The two charts stand side by side on a wide window and one under the other on a narrow one. Each has its own Calculate button under the chart, because the two runs are independent.
The tornado#
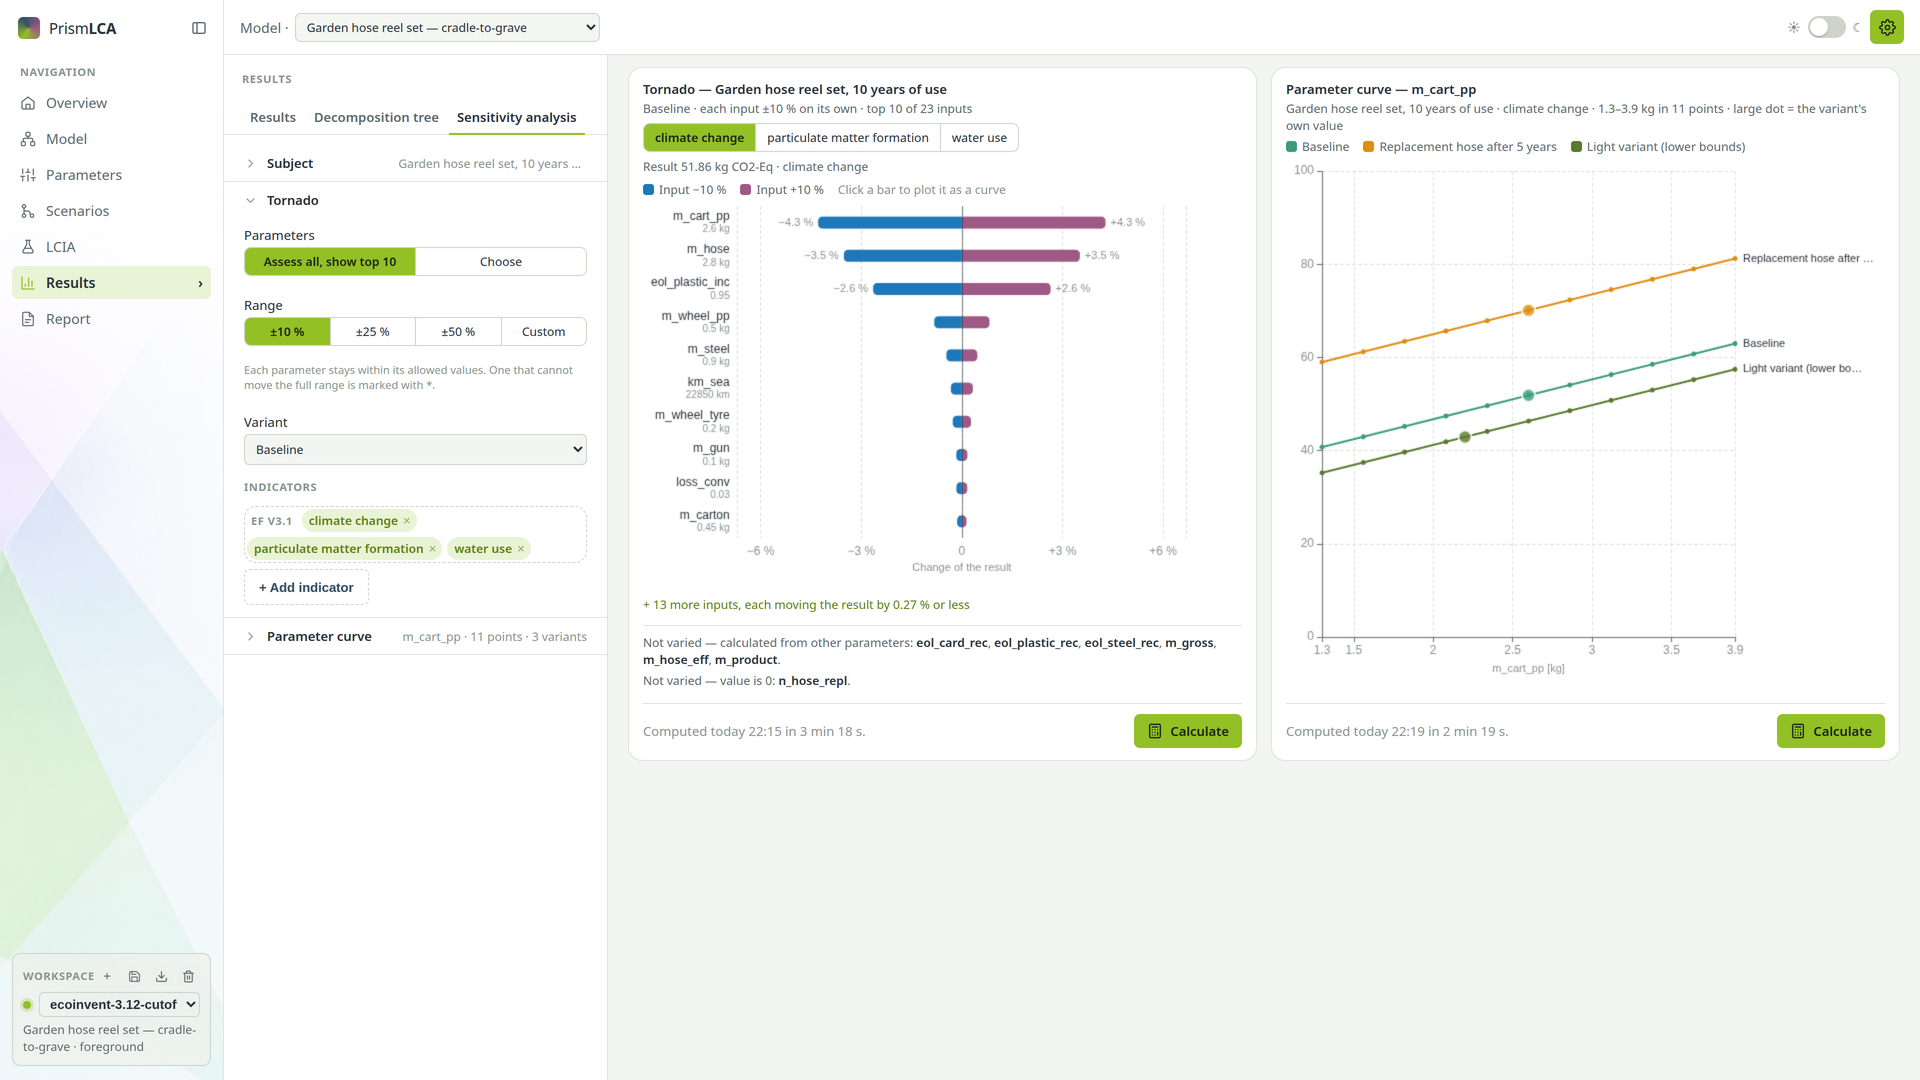
The tornado moves every parameter on its own — all others stay where they are — and calculates the result again. Each row shows how far the result moves when the parameter goes down (blue) and up (purple) by the range you set. The row with the largest swing is at the top. The three top rows carry the change in percent at the ends of their bars; hover over any row for its values and scores.
Choose the parameters#
Under Parameters, Assess all, show top 10 varies every parameter and shows the ten largest bars; the rest are behind + N more inputs under the chart. Choose lets you tick the ones you want.
Set the range#
Range offers ±10 %, ±25 % and ±50 %; Custom takes any value from 1 to 99 %. The same range applies to every parameter.
Pick the variant and the indicators#
Variant is the baseline or one of the model's scenarios: with a scenario, its values are the starting point and stay in for every step. Under Indicators, add as many as you like. Up to three appear as buttons above the chart, more as a list.
Calculate#
Click Calculate under the chart. A run usually takes a few seconds: PrismLCA computes the steps from the model's matrices instead of writing each one into the model. While it runs, the button turns into a progress bar with the step it is on and Cancel. Every step scores all chosen indicators at once.
Two kinds of parameter get no bar of their own, and the lines under the chart say which:
- A parameter calculated from other parameters (a formula such as
2 * mass) is not varied: the parameters in its formula already move it, and a second bar would count the same lever twice. A formula of numbers alone, such as2.5 / 1000, counts as an input and is varied. - A parameter whose value is 0 has no ±10 % to move.
Allowed values and the asterisk#
Every step stays within the parameter's allowed values. A recycling rate of 0.97 with the rule “between 0 and 1” cannot go up by 10 % — that would be 1.067, more returned than sold — so it stops at 1. A parameter that could not move the full range carries an asterisk (*) behind its name, and the line under the chart says how far it went: “return_rate +3.1 % (to 1), between 0 and 1”. With a rule “from a list”, the steps are the neighbouring allowed values; with a list of one value, the parameter is a constant and is not varied.
A step can also break a rule indirectly. If a recycling share is calculated as 1 - incineration -
landfill and has the rule “between 0 and 1”, moving the landfill share up can take the recycling share below
0. Such a bar carries an exclamation mark (!), and the line under the chart names the parameter and the value
it reached: that bar describes a model your own rules exclude. The curve marks points of this kind the same way.
The parameter curve#
The curve shows the result (up) against one parameter (across): where it rises steeply, the parameter matters a lot; where it is flat, it hardly matters. Unlike the tornado it is not limited to a small step around the current value.
Choose the parameter and the range#
Pick the Parameter, then From, To and the number of Points (2 to 50). Values the parameter's rule does not allow are refused right there. For a parameter with a list rule the list's values are the points.
Choose the indicator and the variants#
Pick one indicator under Method family and Indicator, and tick the Variants to draw: the baseline and any scenarios, one line each.
Calculate and read#
The small dots are the calculated points; between them the line is drawn straight. The large dot on each line is the value the parameter has in that variant — where the model stands today.
Keeping and exporting the results#
Both results are kept with the model: switch to another page or model, or restart PrismLCA, and they are still there. If you change the settings, the card says Settings changed — the chart shows the last run; if the model changed since the run, it says The model changed since this run — calculate again. A run that is still going keeps going while you work elsewhere; if you edit the model meanwhile, it stops and asks to be started again.
A few models cannot be computed that way — for example one with activity parameters that carry formulas, brought in by an import. Then every step is written into the model and calculated in full: a run takes a few seconds per parameter, and other calculations and parameter edits wait until it is done or until you click Cancel. The numbers are the same either way.
The tornado in a report#
The short and the full report can print the tornado under the sensitivity check in Interpretation checks: tick Parameter sensitivity (tornado), choose indicators from the report's own and a range. In a report it always starts from the baseline of the reference process, one figure per indicator. See Full report and Short report.
Hover over a chart and use the save button in its corner to keep it as a PNG.
See also: Scenarios · Parameters