HandbookGet started
Tutorial: your first model
In this tutorial you build a small product system by hand — a garden hose reel set — and calculate its climate impact. Along the way you use every basic move in PrismLCA: create a model, find datasets, add your own processes, link them with amounts, calculate and read the result.
Before you start#
- A workspace with the BAFU database, and its search index finished (the search panel no longer shows Indexing…). See Set up your first workspace. With ecoinvent the steps are the same; only the dataset names differ.
- About thirty minutes. No API key: this tutorial does not use the assistant.
What you will build#
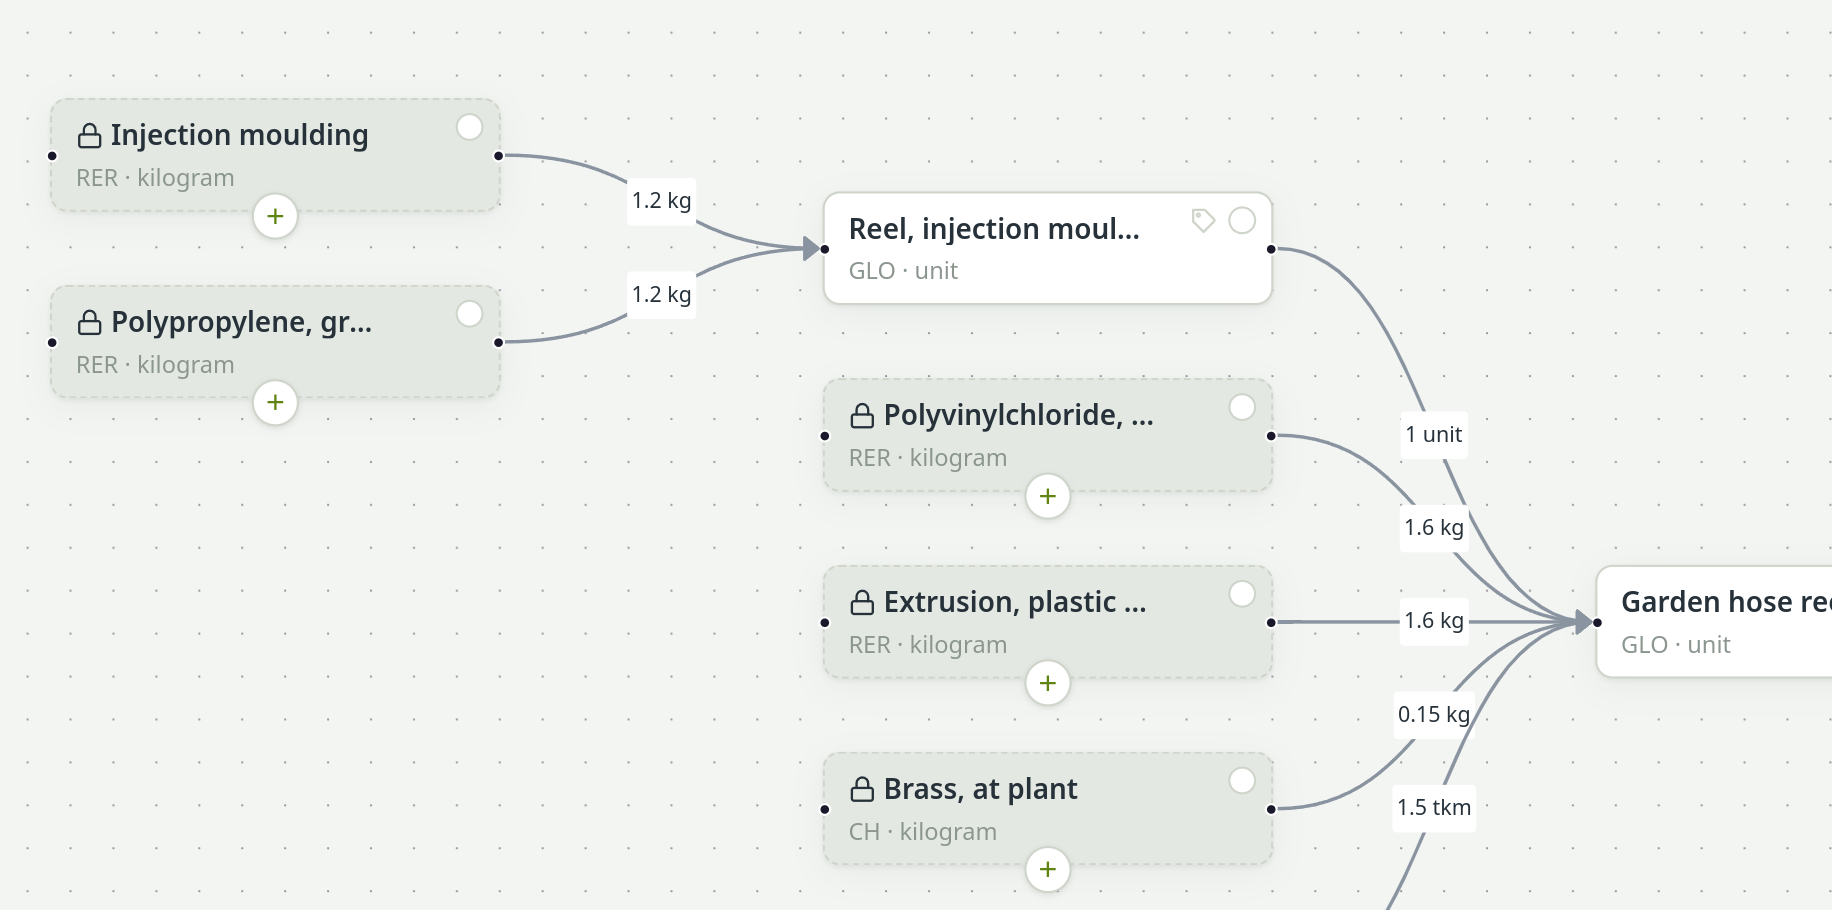
The set is a polypropylene reel with 20 m of PVC hose and brass fittings, trucked to a retailer. You model two processes of your own and link six background datasets to them:
| Your process | Input (BAFU dataset) | Amount |
|---|---|---|
| Reel, injection moulded (1 unit) | Polypropylene, granulate, at plant | 1.2 kg |
| Injection moulding | 1.2 kg | |
| Garden hose reel set (1 unit) | Reel, injection moulded (your process) | 1 unit |
| Polyvinylchloride, at regional storage | 1.6 kg | |
| Extrusion, plastic pipes | 1.6 kg | |
| Brass, at plant | 0.15 kg | |
| Transport, freight, lorry, 16t-32t gross weight, fleet average | 1.5 tkm |
The transport amount is mass times distance: about 3 kg over 500 km is 1.5 tonne-kilometres (tkm).
Create the model#
Open the New model dialog#
On the Overview, click Model (the button with the plus). On a workspace that has no model yet, the card in front of the app offers New model… instead.
Fill it in#
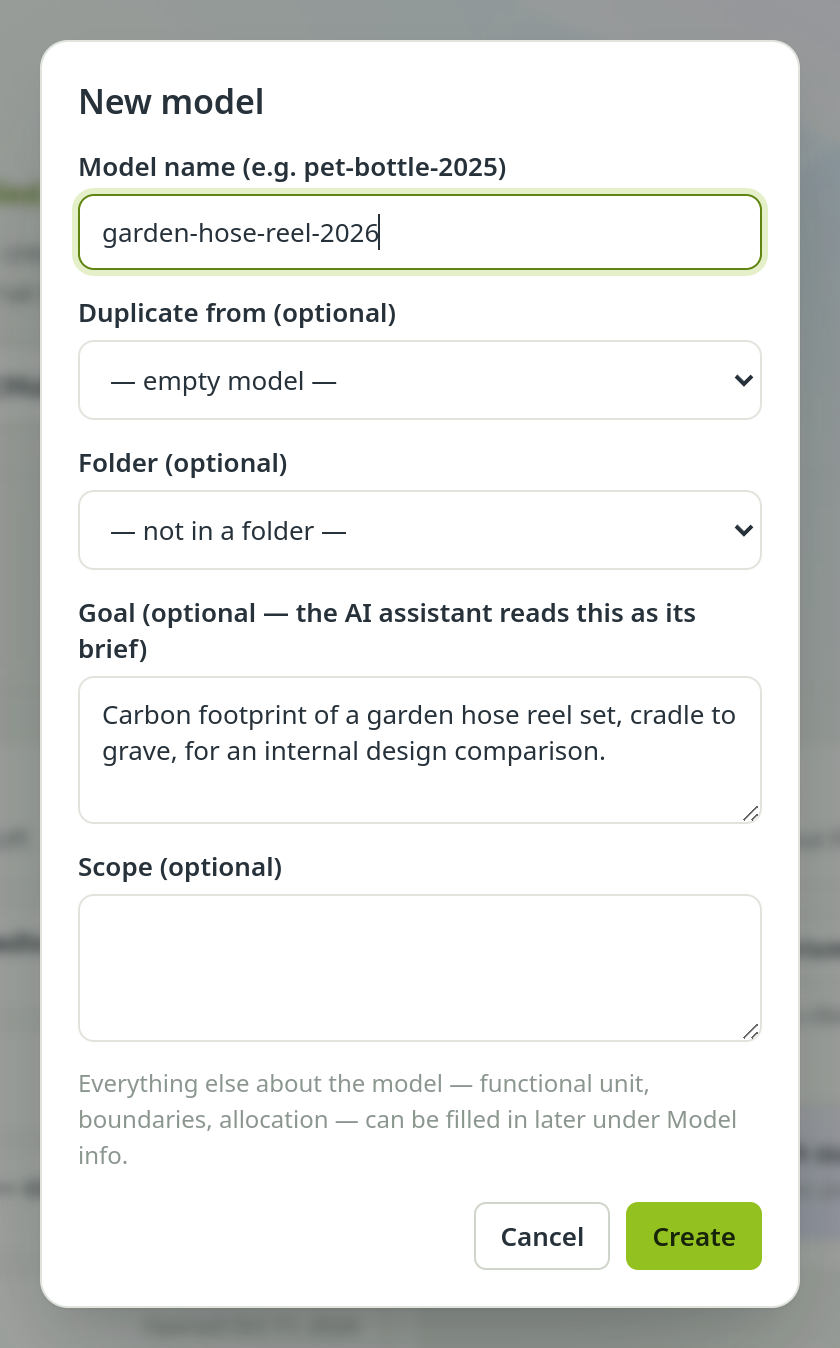
Type a name in Model name, for example
hose-reel-tutorial. Leave Duplicate from and Folder empty. In Goal, write one sentence on what you want to know:Climate impact of a garden hose reel set, cradle to retailer, as a modelling exercise.
Click Create.
The New model dialog. Open the canvas#
The new model is now the active one. Click Model in the sidebar if you are not already there: you see the search panel on the left, an empty canvas in the middle and the inspector on the right.
Write down the functional unit#
Click the Model button with the tree icon in the toolbar. Under Object of study, enter the Functional unit: 1 garden hose reel set with 20 m of hose, delivered to the retailer, and click Close: the sheet saves when it closes. The text is for readers and for the report; what the calculation counts comes later, in the “Calculate” section.
Add your own processes#
Create the final product#
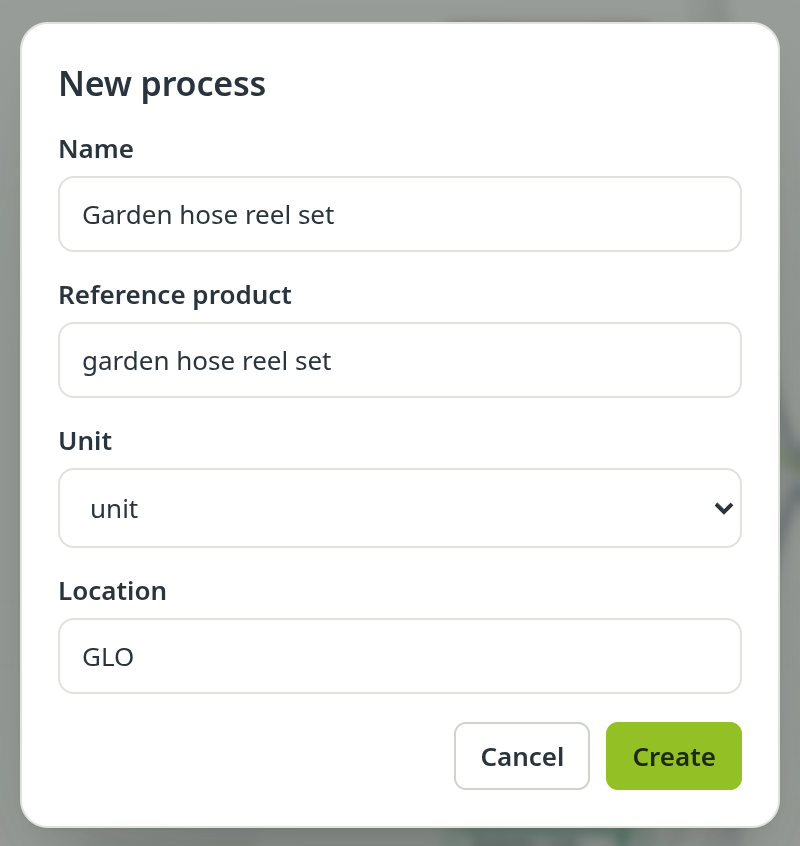
Click Process in the toolbar (or right-click the empty canvas and choose + New process here). In the New process dialog enter:
- Name: Garden hose reel set
- Reference product: garden hose reel set
- Unit: unit
- Location: leave it at GLO
Click Create. A box appears on the canvas, selected, with the inspector open on it. Its reference output is 1 unit — one set.
The New process dialog. Create the reel#
Do the same for a second process: Name Reel, injection moulded, Reference product reel, Unit unit.
Arrange them#
Drag the boxes so that the reel stands to the left of the set. Products flow from left to right on the canvas.
Find the background datasets#
Search#
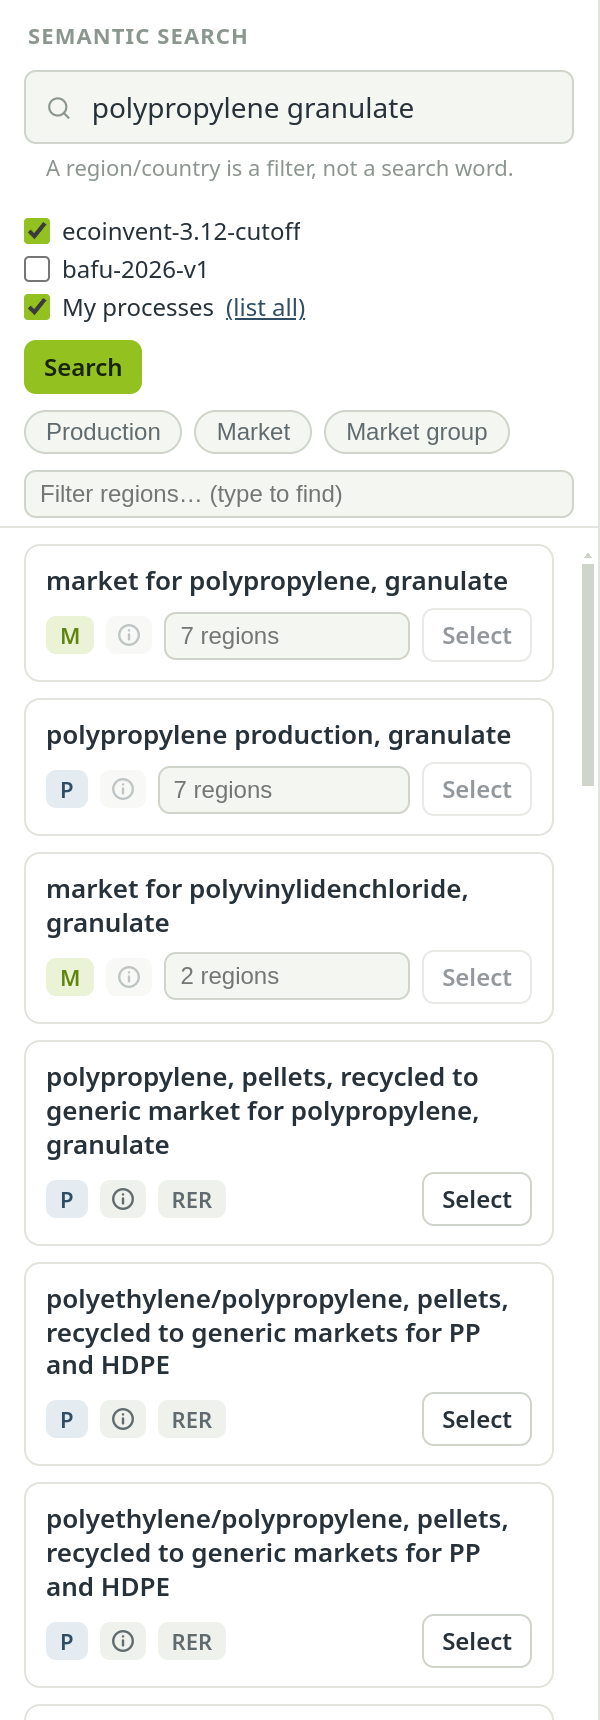
In the Semantic search panel, check that the BAFU database is ticked. Type polypropylene granulate and press Enter.
Check before you take#
Find Polypropylene, granulate, at plant (region RER) in the results. Click its ⓘ button to read the dataset: what it covers, where, which year. A search hit is a suggestion, not a verified choice.
Search results with type, region and the Select button. Place it#
Click Select (or drag the hit onto the canvas). A locked box appears: a reference to the BAFU dataset, which you use but cannot change.
Repeat for the other five#
Search and place Injection moulding, Polyvinylchloride, at regional storage, Extrusion, plastic pipes, Brass, at plant and Transport, freight, lorry, 16t-32t gross weight, fleet average. Useful search words: injection moulding, PVC, plastic pipe extrusion, brass, freight transport by truck.
Link everything with amounts#
An arrow on the canvas is an input: the supplier on the left delivers to the consumer on the right. The amount is always per one unit of the consumer's reference output.
Draw the first link#
Point at the right edge of the Polypropylene, granulate, at plant box until the handle shows, then drag to the left edge of Reel, injection moulded. The Add exchange dialog asks for the Amount. Type
1.2and click Add. The amount is in the supplier's unit, here kilograms.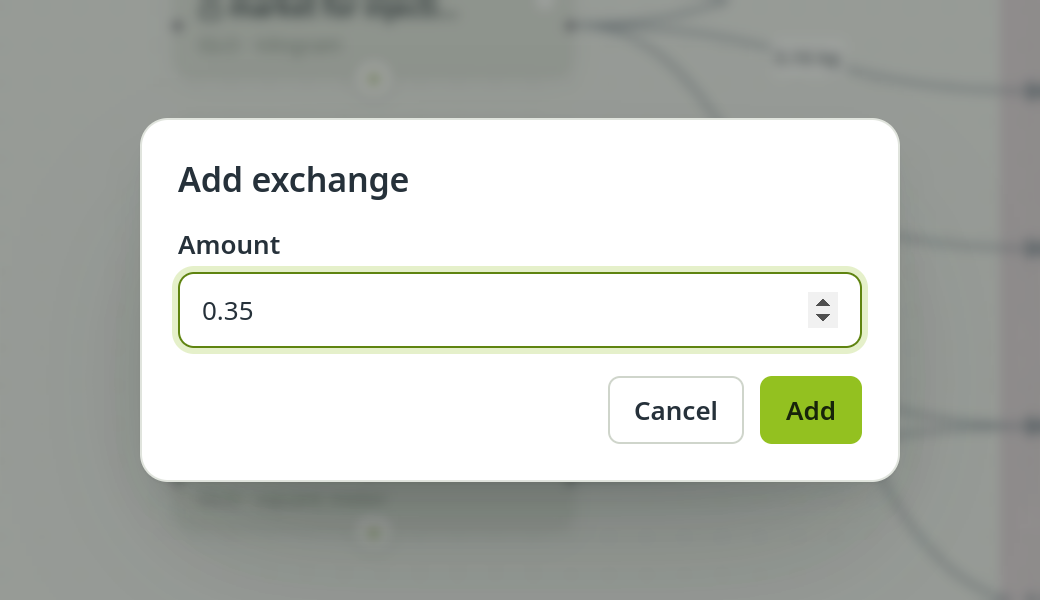
Linking two boxes: the Add exchange dialog. Finish the reel#
Link Injection moulding to the reel with
1.2.Link the reel into the set#
Drag from the right edge of Reel, injection moulded to the left edge of Garden hose reel set, amount
1.Link the rest into the set#
Link the PVC (
1.6), the extrusion (1.6), the brass (0.15) and the transport (1.5) to Garden hose reel set.Check in the inspector#
Click Garden hose reel set. The inspector shows its Reference product (1 unit) and, on the Inputs tab, five inputs with their amounts. To correct an amount, change it there or click the number on the arrow.
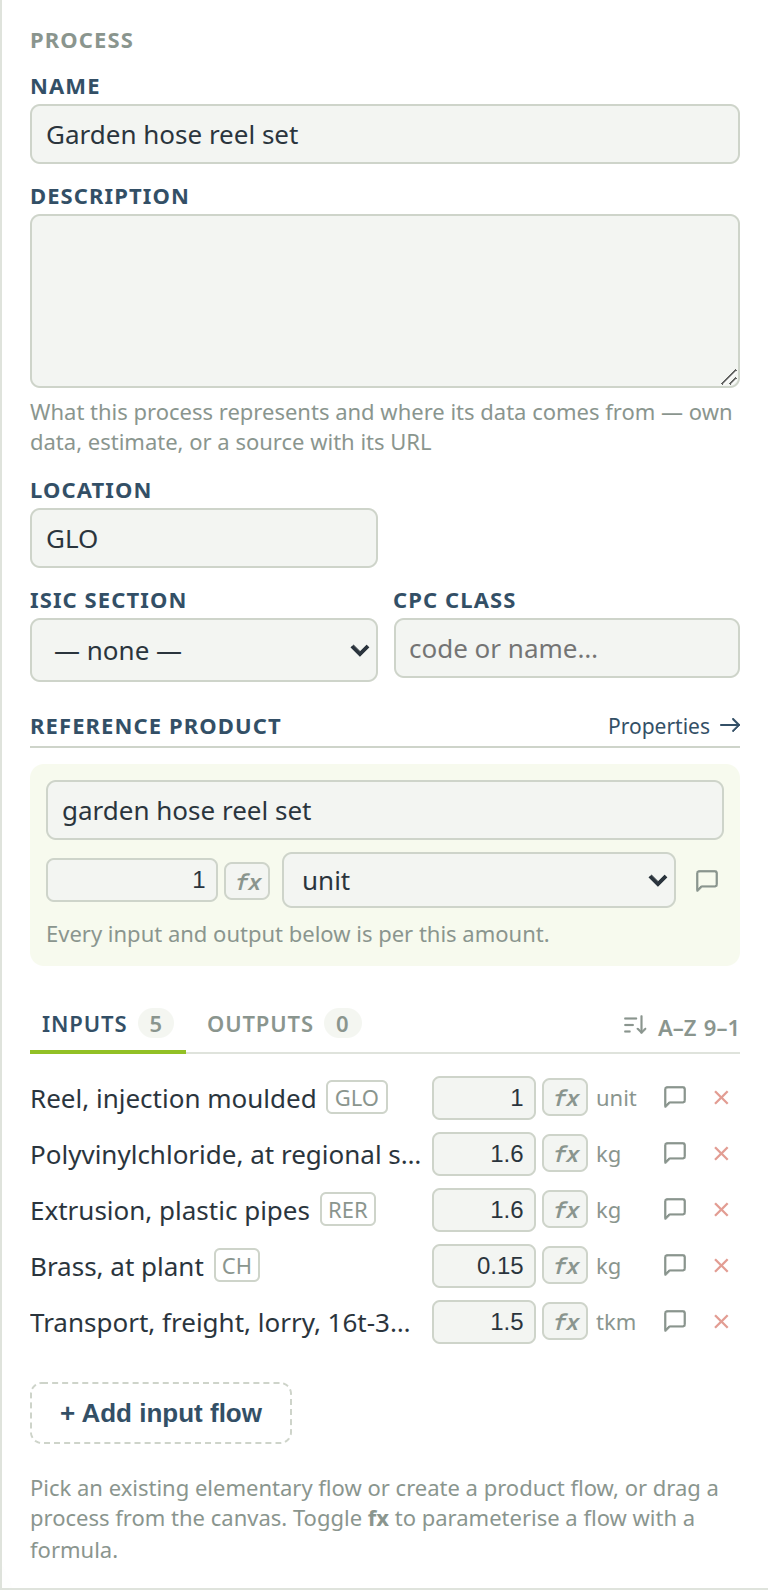
The finished set in the inspector.
Calculate#
Choose the method#
Open the method selector in the toolbar and choose ★ EF v3.1 · climate change · global warming potential (GWP100). The ★ marks the standard reporting indicator of a category; variants such as “climate change: fossil” cover only part of it.
Select the functional unit#
Click the Garden hose reel set box so that it is the only one selected. The toolbar shows FU: 1 unit: the calculation is for one set.
Click Calculate#
A result bar appears above the canvas with the score and its unit (kilograms of CO2 equivalents), the method, the functional unit (Garden hose reel set) and how many nodes of the supply chain were included. Every box now shows its share of the result as a percentage, and the arrows grow thicker where more of the impact flows. clear on the right removes the overlay.
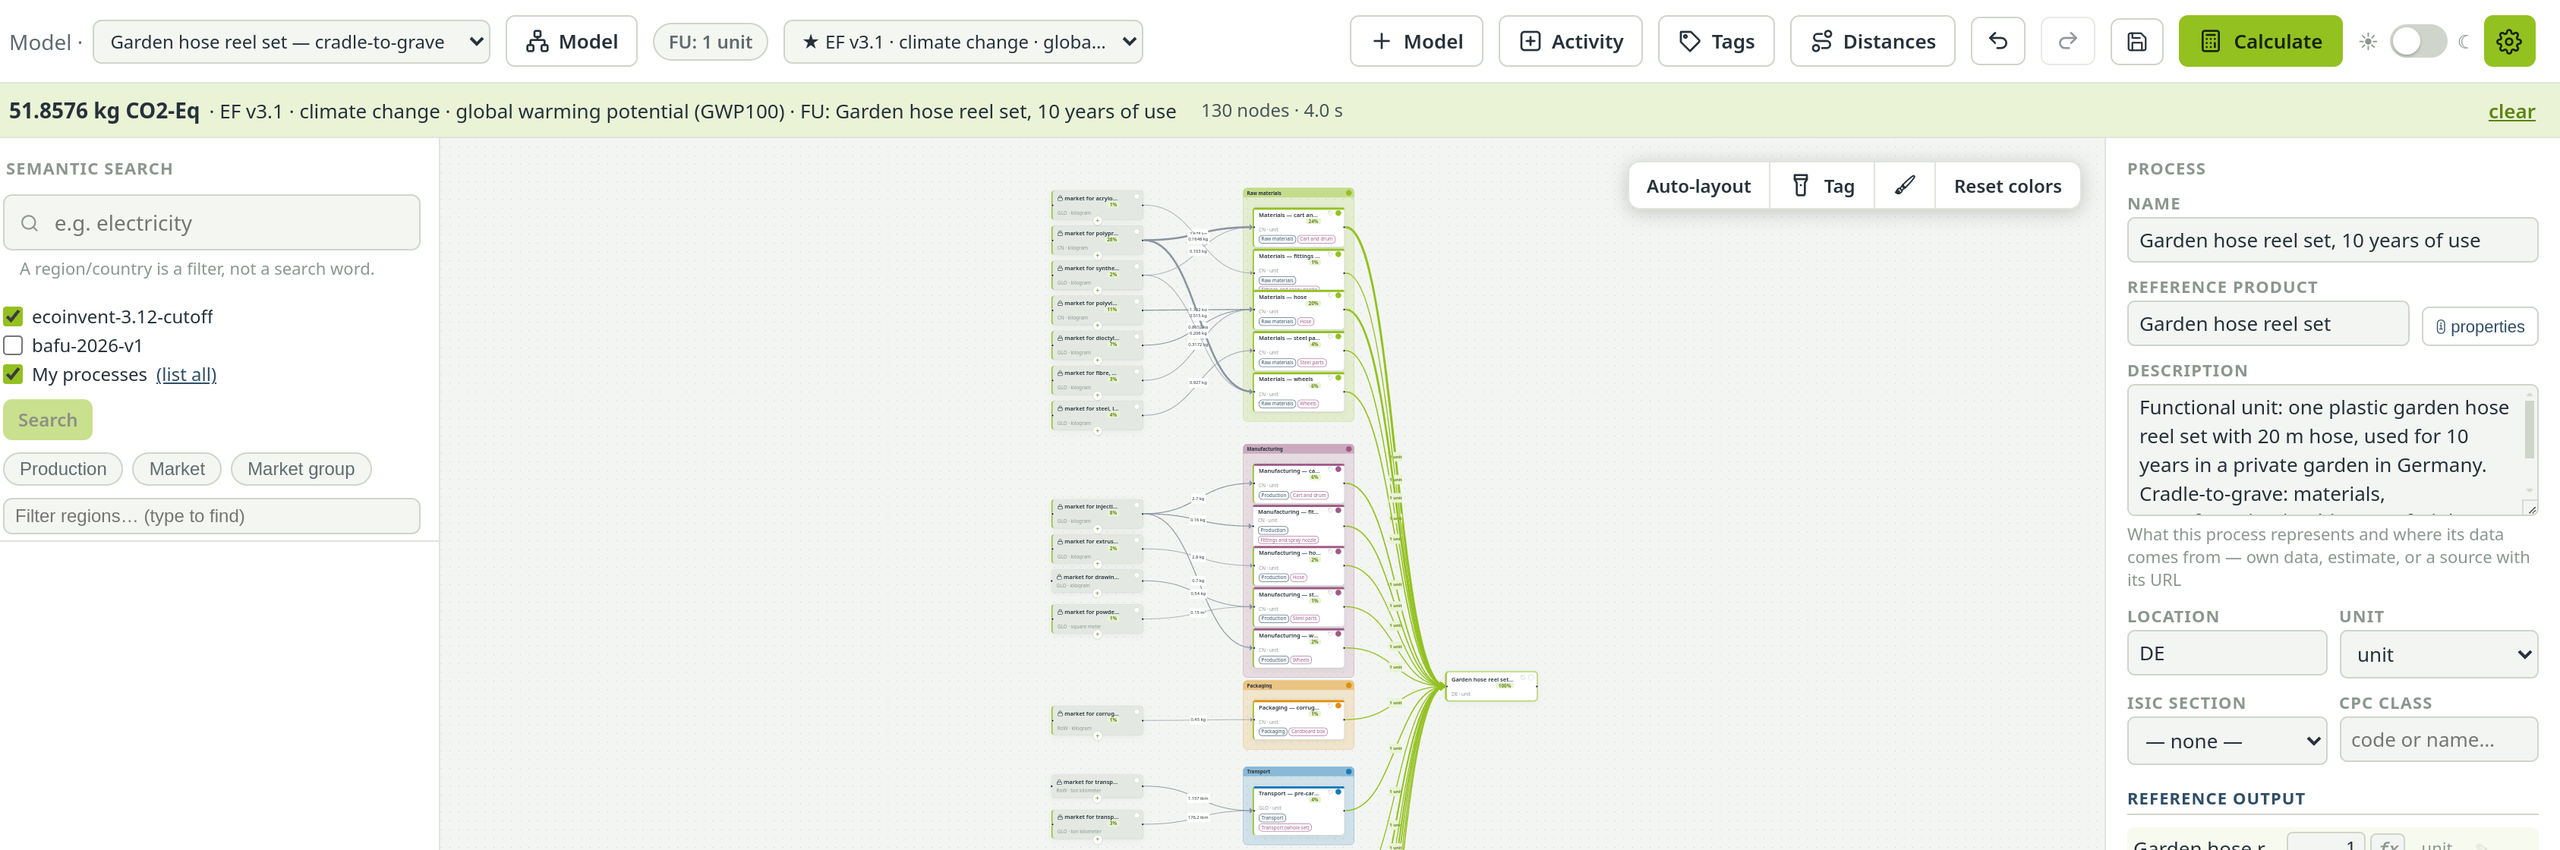
After Calculate: the score, and where it comes from.
Open the Results page#
The result bar answers one question for one process. The Results page compares and explains.
Go to Results#
Click Results in the sidebar. Its first tab, also called Results, opens with Garden hose reel set already ticked under Subjects — PrismLCA starts with the process that no other process of the model consumes.
Pick indicators#
Under Indicators, click + Add indicator. Choose EF v3.1 in the left list and climate change on the right. Add two or three more, such as acidification or water use, then click Done.
Calculate#
Click Calculate at the bottom of the left column. You get one chart per indicator.
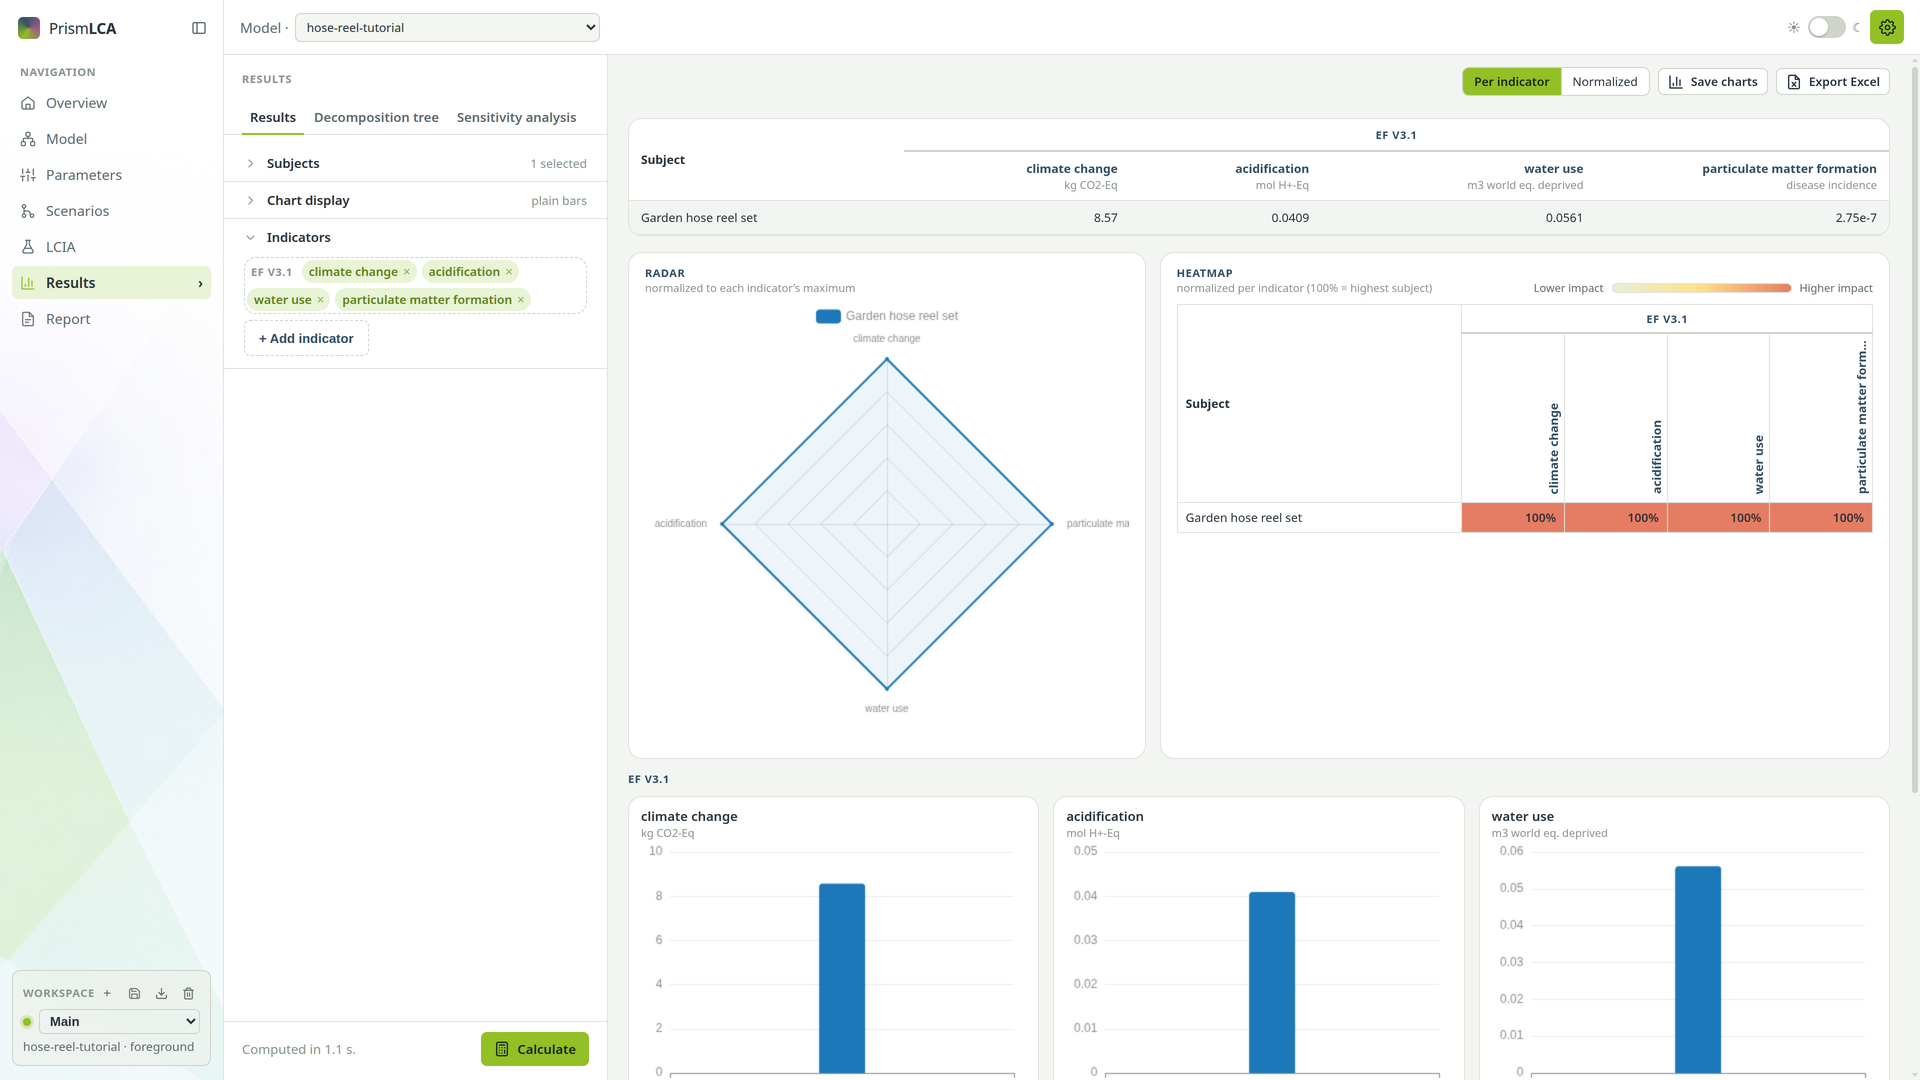
Results for the tutorial model. Look inside#
Switch to Decomposition tree to see which processes and which elementary flows make up the score. That is where you find the hotspots — see Find the hotspots.
What you have learned#
- A model is your foreground; background datasets are locked references you link to.
- Arrows run from supplier to consumer, with amounts per unit of the consumer.
- Calculate computes one unit of the selected process with the chosen method.
- Every step you took is in the Audit log and can be undone with Undo.
See also: Life-cycle phases and tags · Parameters and formulas · Scenarios