HandbookGet started
Find your way around
One picture of the window, then each area in turn: what it is for and where you find it. After this page you know where to look for everything the rest of the handbook talks about.
The window in one picture#
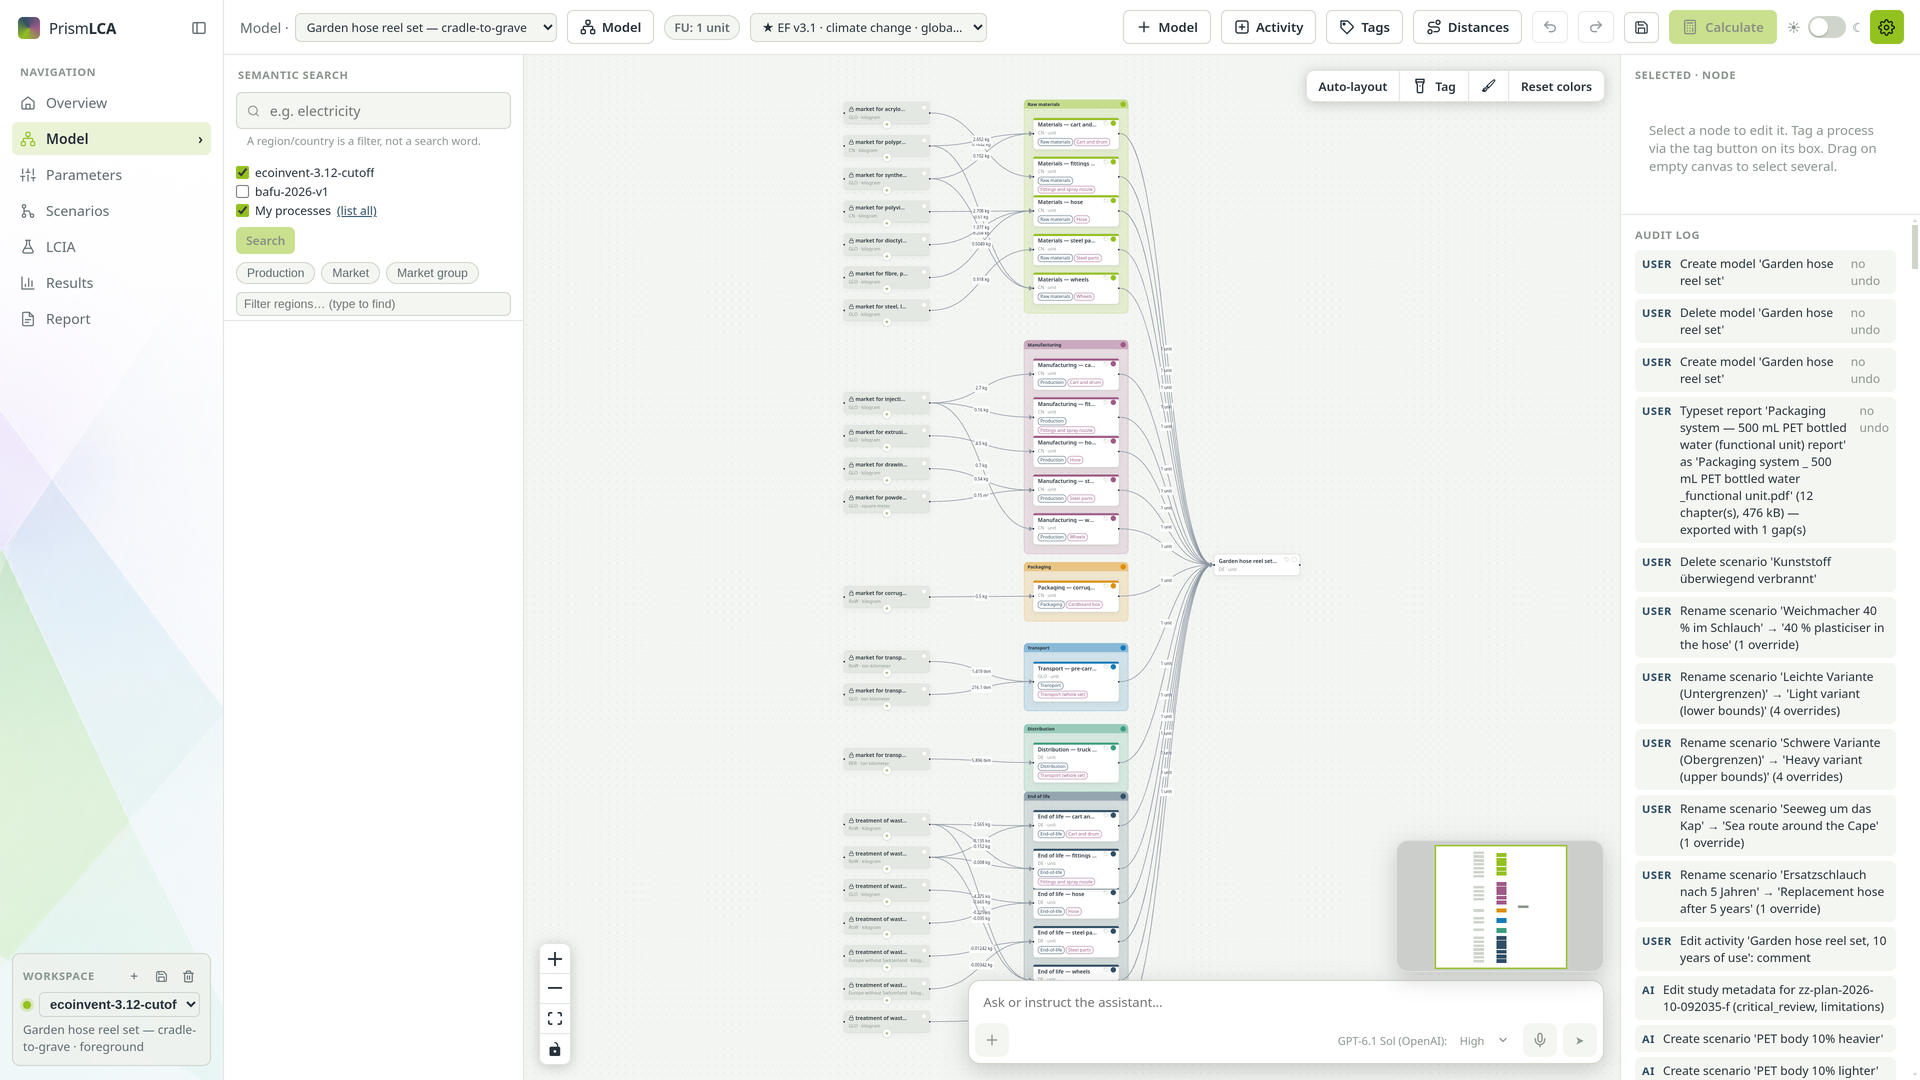
- Sidebar
- On the left: the seven pages of a study, top to bottom, and the Workspace block at the bottom.
- Toolbar
- Along the top: the model you are working on, the functional unit, the impact method, the actions on the model, Calculate, and on the far right the dark-mode switch and the Settings gear.
- Search panel
- Left column of the Model page: find background datasets by describing them.
- Canvas
- The middle: your product system as boxes (processes) and arrows (flows).
- Inspector and audit log
- Right column: the details of the selected process, and below them every change made to the model.
- Chat dock
- Bottom right of the canvas: the optional AI assistant.
The sidebar: seven pages, in the order of a study#
The entries in the sidebar (headed Navigation) are not a menu of features. They follow the order of a study: work down them and you have done an LCA.
| Page | What it is for |
|---|---|
| Overview | The start page: your models (with folders), key numbers for the workspace, the last models you opened, What's new, the Handbook button and Take the tour again. |
| Model | The canvas. Build the product system, link it to background data, calculate. |
| Parameters | Named values and formulas that drive amounts on the canvas, so one change moves every flow that depends on it. See Parameters and formulas. |
| Scenarios | Sets of different parameter values — a recycled-plastic variant, a longer transport — without a second model. See Scenarios. |
| LCIA | The impact methods: Compare factors side by side, and Manage methods to build your own. See Impact methods. |
| Results | Three tabs: Results compares models, scenarios and datasets across indicators; Decomposition tree shows the contribution tree and the elementary flows; Sensitivity analysis shows which parameters move the result. See Compare results. |
| Report | Full reports (AI), drafted chapter by chapter by the assistant and released by you, and Short reports (w/o AI), generated from the model alone. Both end as a PDF. See The full study report. |
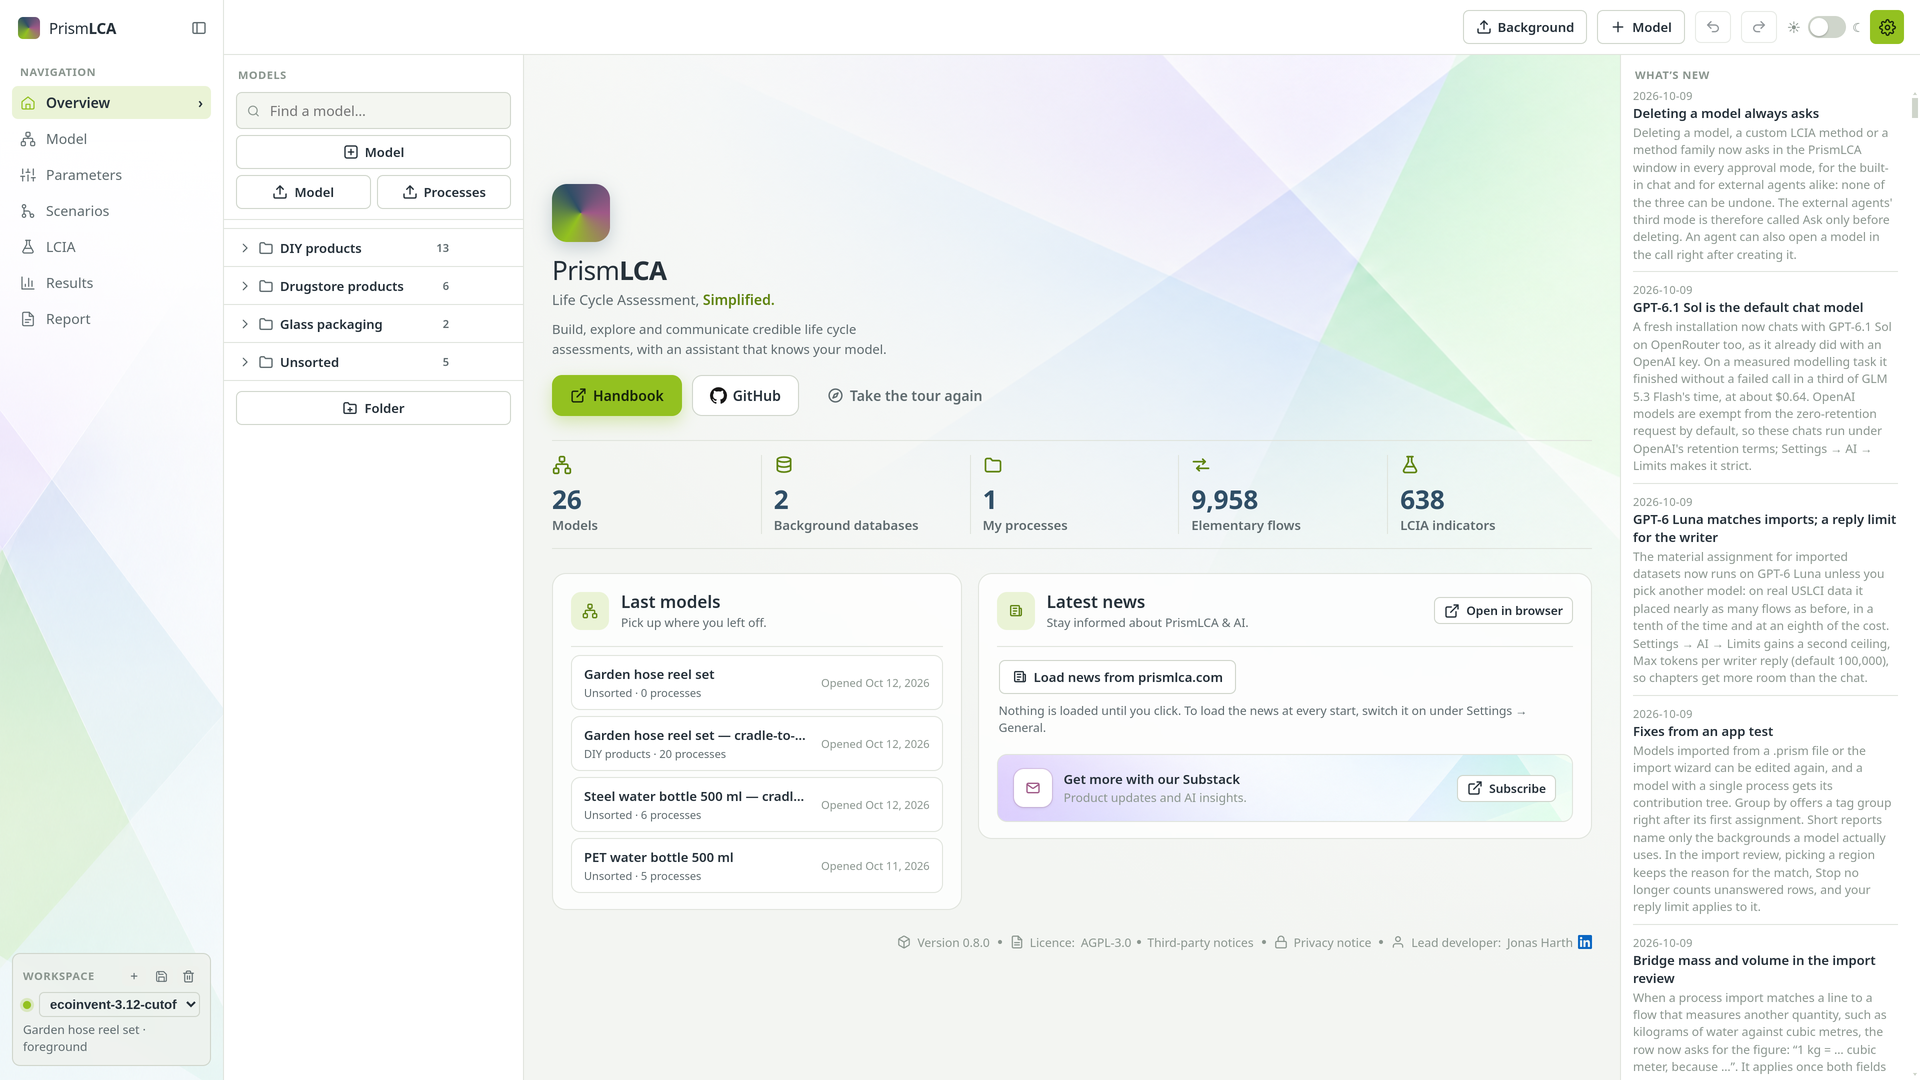
The small button beside the PrismLCA logo, Collapse sidebar, folds the sidebar to a strip of icons when you need room; click the strip to unfold it again.
The Workspace block#
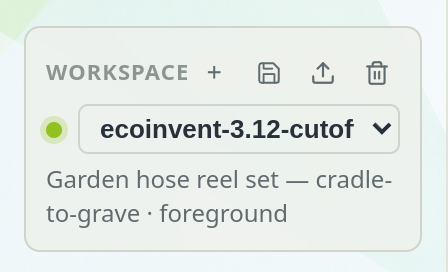
At the bottom of the sidebar sits the Workspace block. Its dropdown switches between workspaces; below it you see the model you are on and whether it is a foreground model or the library. Four small buttons sit beside the title: New workspace (+), Back up this workspace, Restore a workspace backup and Delete workspace.
The model toolbar#

| Control | What it does |
|---|---|
| Model · (dropdown) | Switches to another model of this workspace. |
| Model (tree icon) | Opens Model info: goal and scope, functional unit, system boundaries, allocation, authors. |
| FU: 1 … | Shows the functional unit of the calculation: one reference unit of the process you selected. |
| Method selector | The impact method for Calculate. A ★ marks the standard reporting indicator of its category. |
| Model (plus icon) | Creates a new model, or duplicates one. |
| Process | Adds a new process of your own to the canvas. |
| Tags | Manages tag groups such as life-cycle phases. See Life-cycle phases and tags. |
| Distances | Road, sea, air and rail distances between two places. See Transport distances. |
| Undo, Redo | Take back the last change, or bring it back. |
| Export model | Writes the model to a .prism file. |
| Calculate | Calculates the selected process with the chosen method. It needs exactly one selected process. |
Other pages show a shorter toolbar. On the Overview it holds Background (everything about your background data), Model and Undo/Redo; on LCIA it holds the two tabs.
The search panel#
The Semantic search panel finds background datasets by meaning. Describe what you need in plain words — freight transport by truck — and press Enter or Search. Below the field you tick which databases to search, filter by type (Production, Market, Market group) and by region.
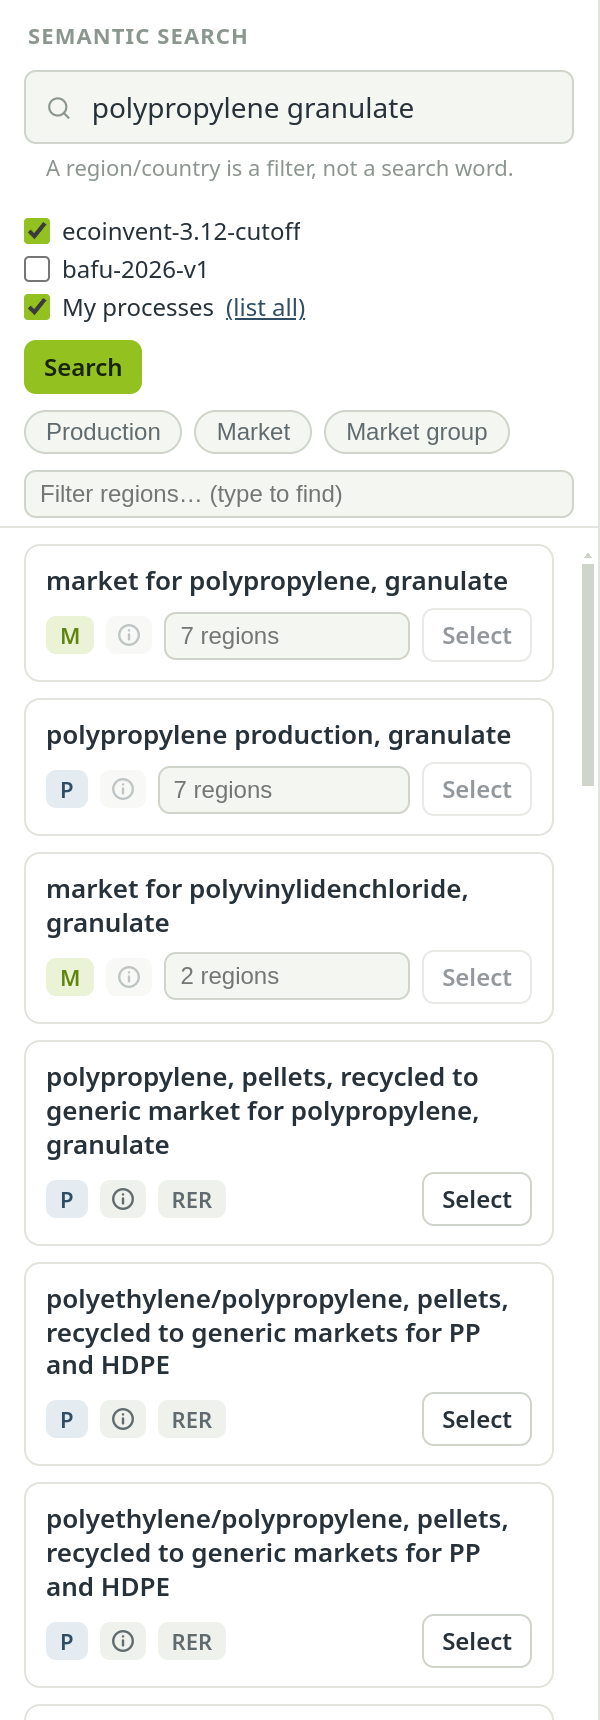
Each hit has an ⓘ button for the full dataset, and Select to place it on the canvas (or drag it there). A dataset that exists in several regions shows a region picker first. See Find the right dataset.
The canvas#
The canvas shows your product system. Your own processes are editable boxes; background datasets appear as locked boxes (references) that you use but cannot change. Arrows run from the supplier on the left to the process that consumes it on the right, and each arrow carries its amount.
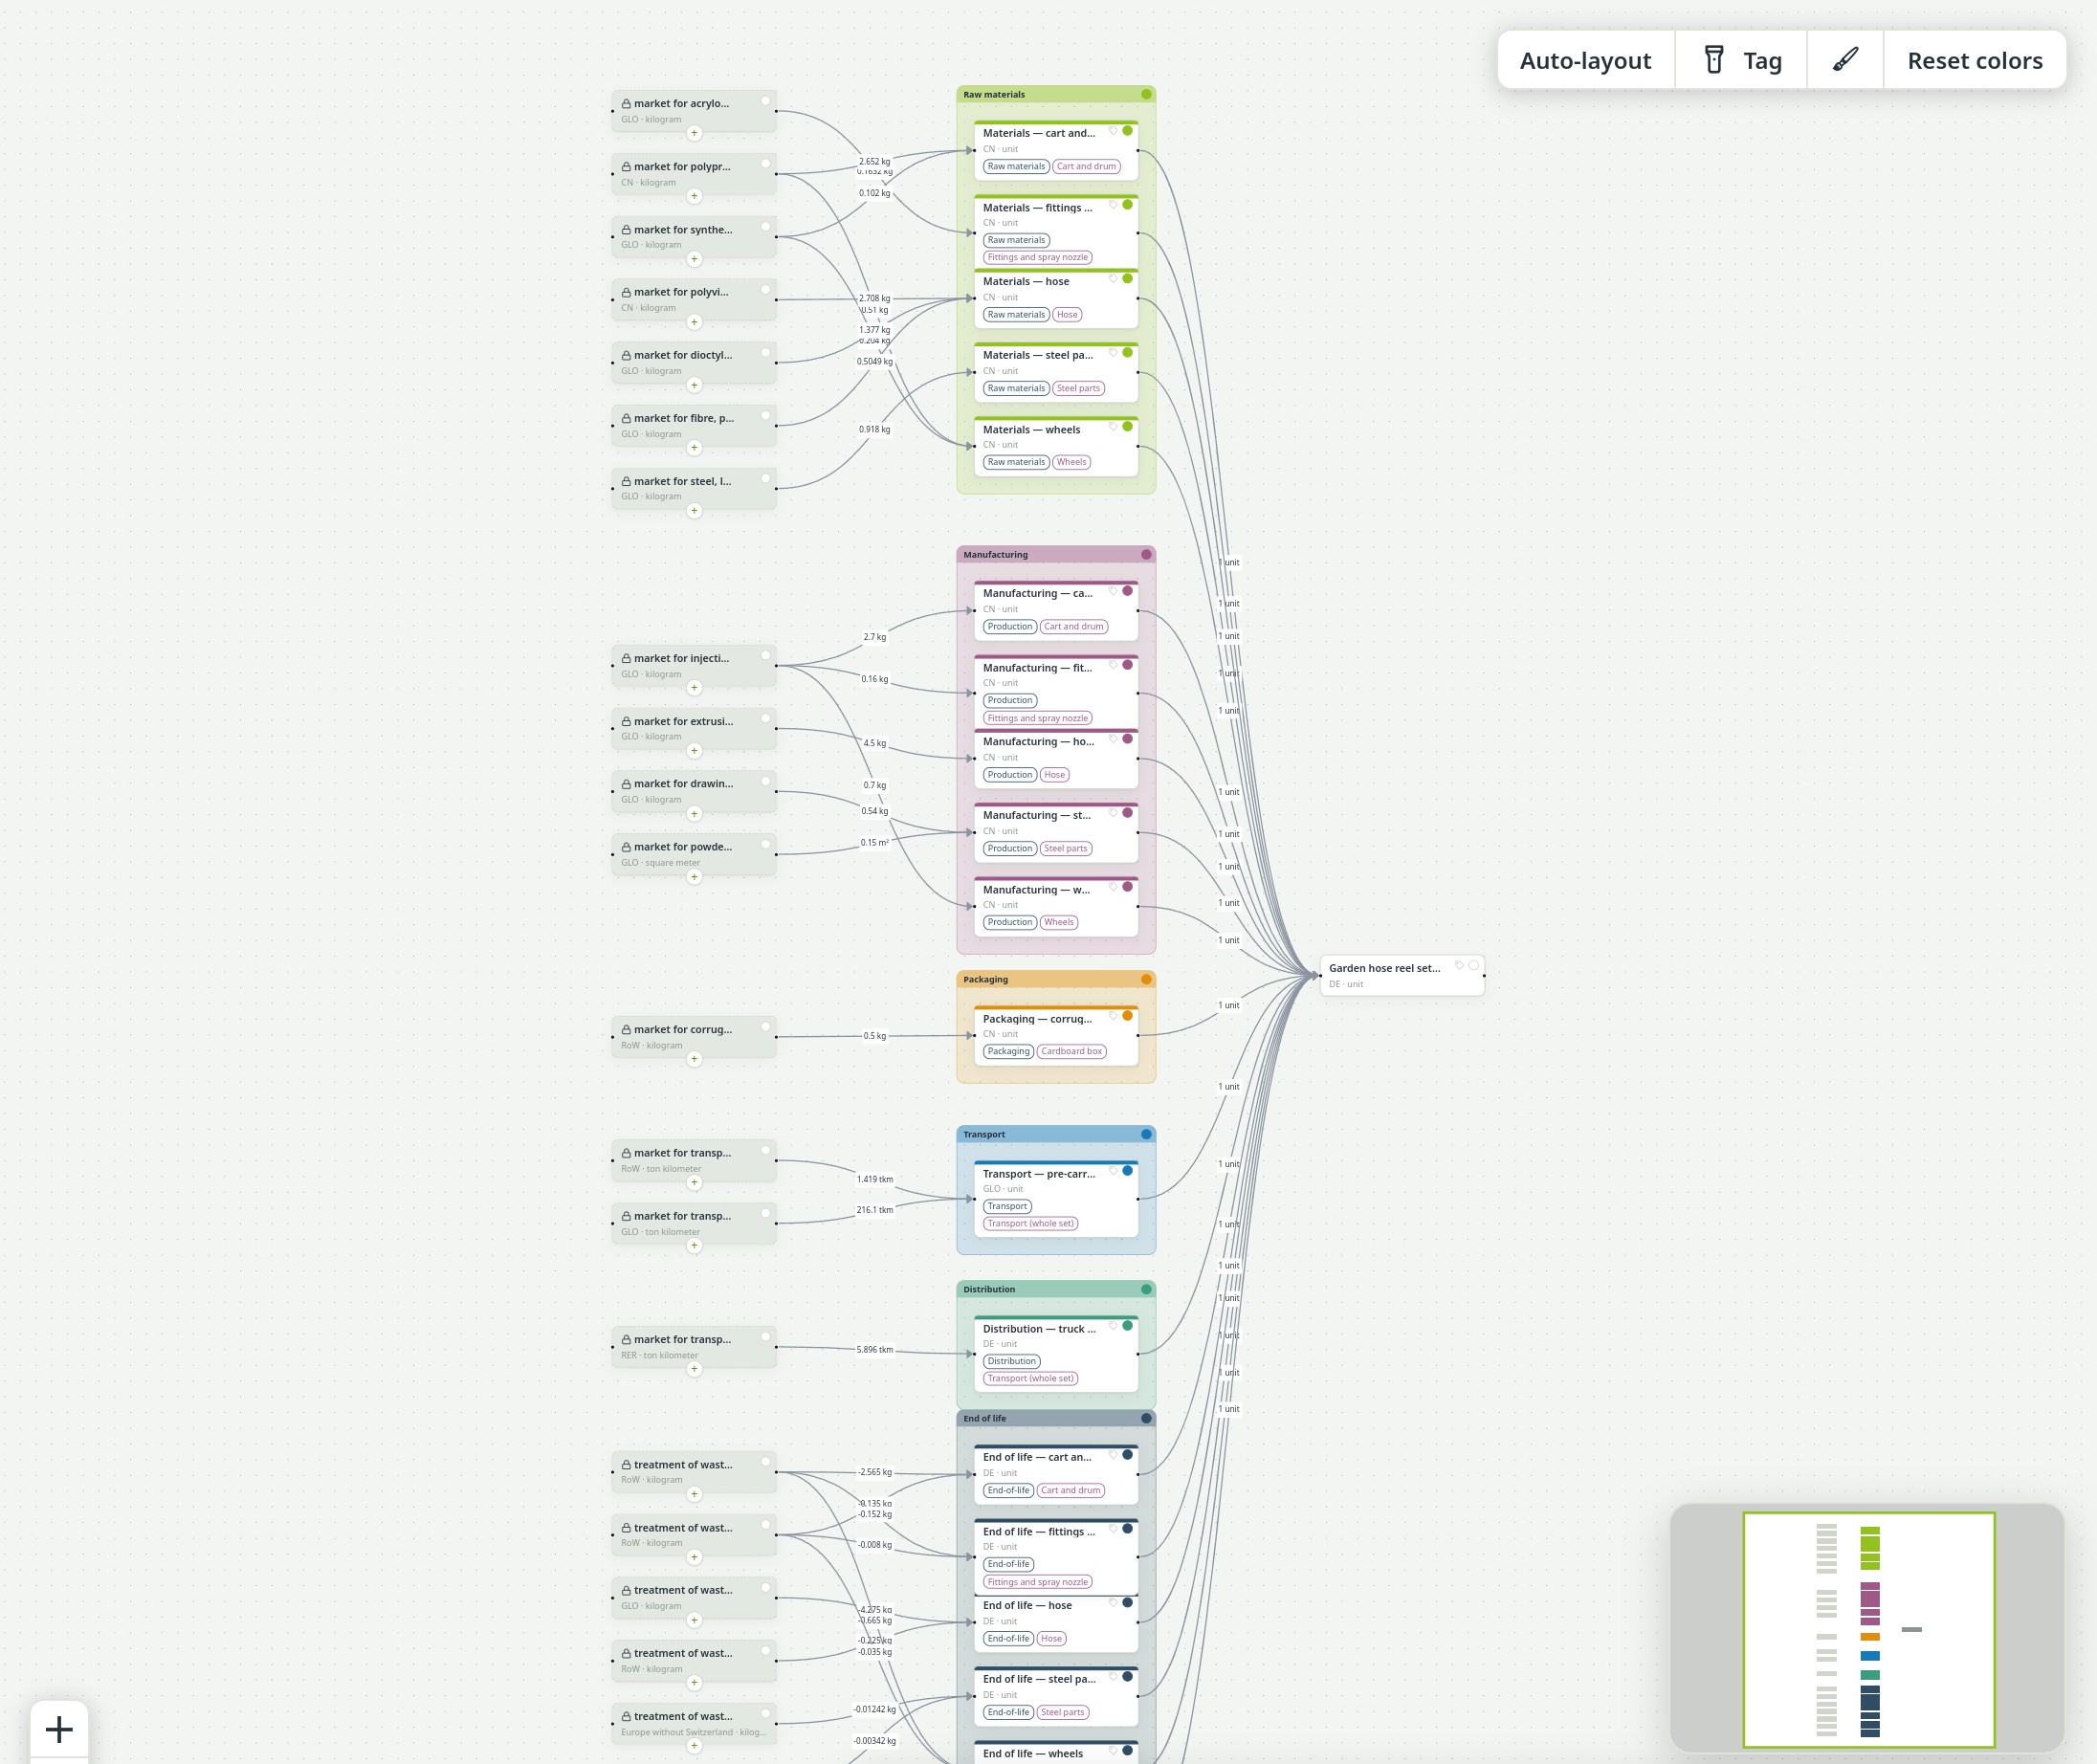
- Right-click a box for its menu: on a locked box Localize (edit) and Remove from canvas; on your own process Duplicate, Move to library and Delete.
- Right-click empty canvas for + New process here.
- Drag on empty canvas to select several boxes; the middle mouse button pans.
- Above the canvas: Auto-layout, a tag highlighter, a colour brush and Clear all node colours.
See Build on the canvas for all of it.
The inspector and the audit log#
Click a box and the right column shows it: name, description, location and classification, its Reference product with amount and unit, and its flows on the tabs Inputs and Outputs. For your own processes every field is edited in place; a background dataset is shown read-only with a padlock.
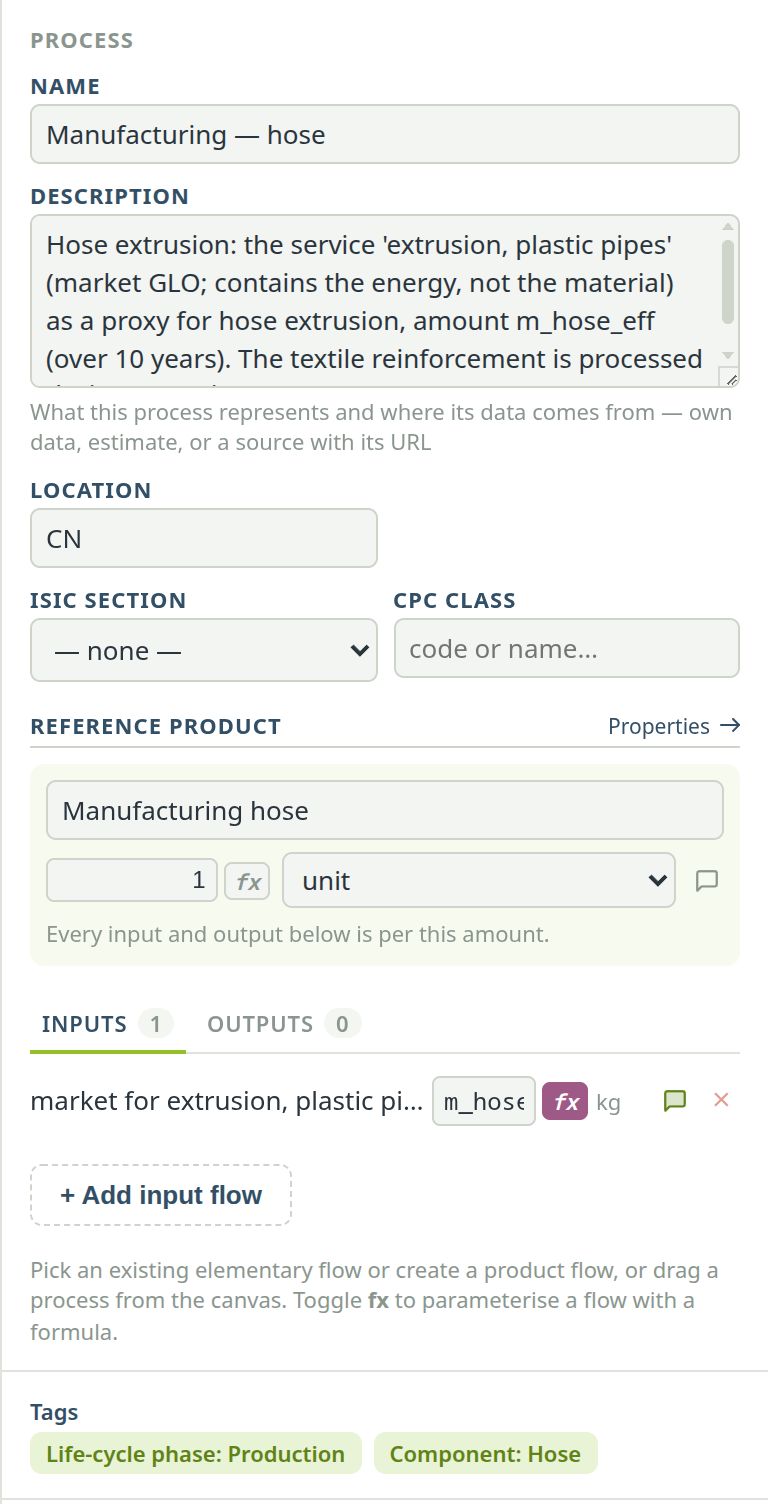
Below the inspector, the Audit log lists every change to the model with its author — you, the assistant or an external agent. Parameters and Scenarios have the same log. See Check, undo and the audit log.
The chat dock#
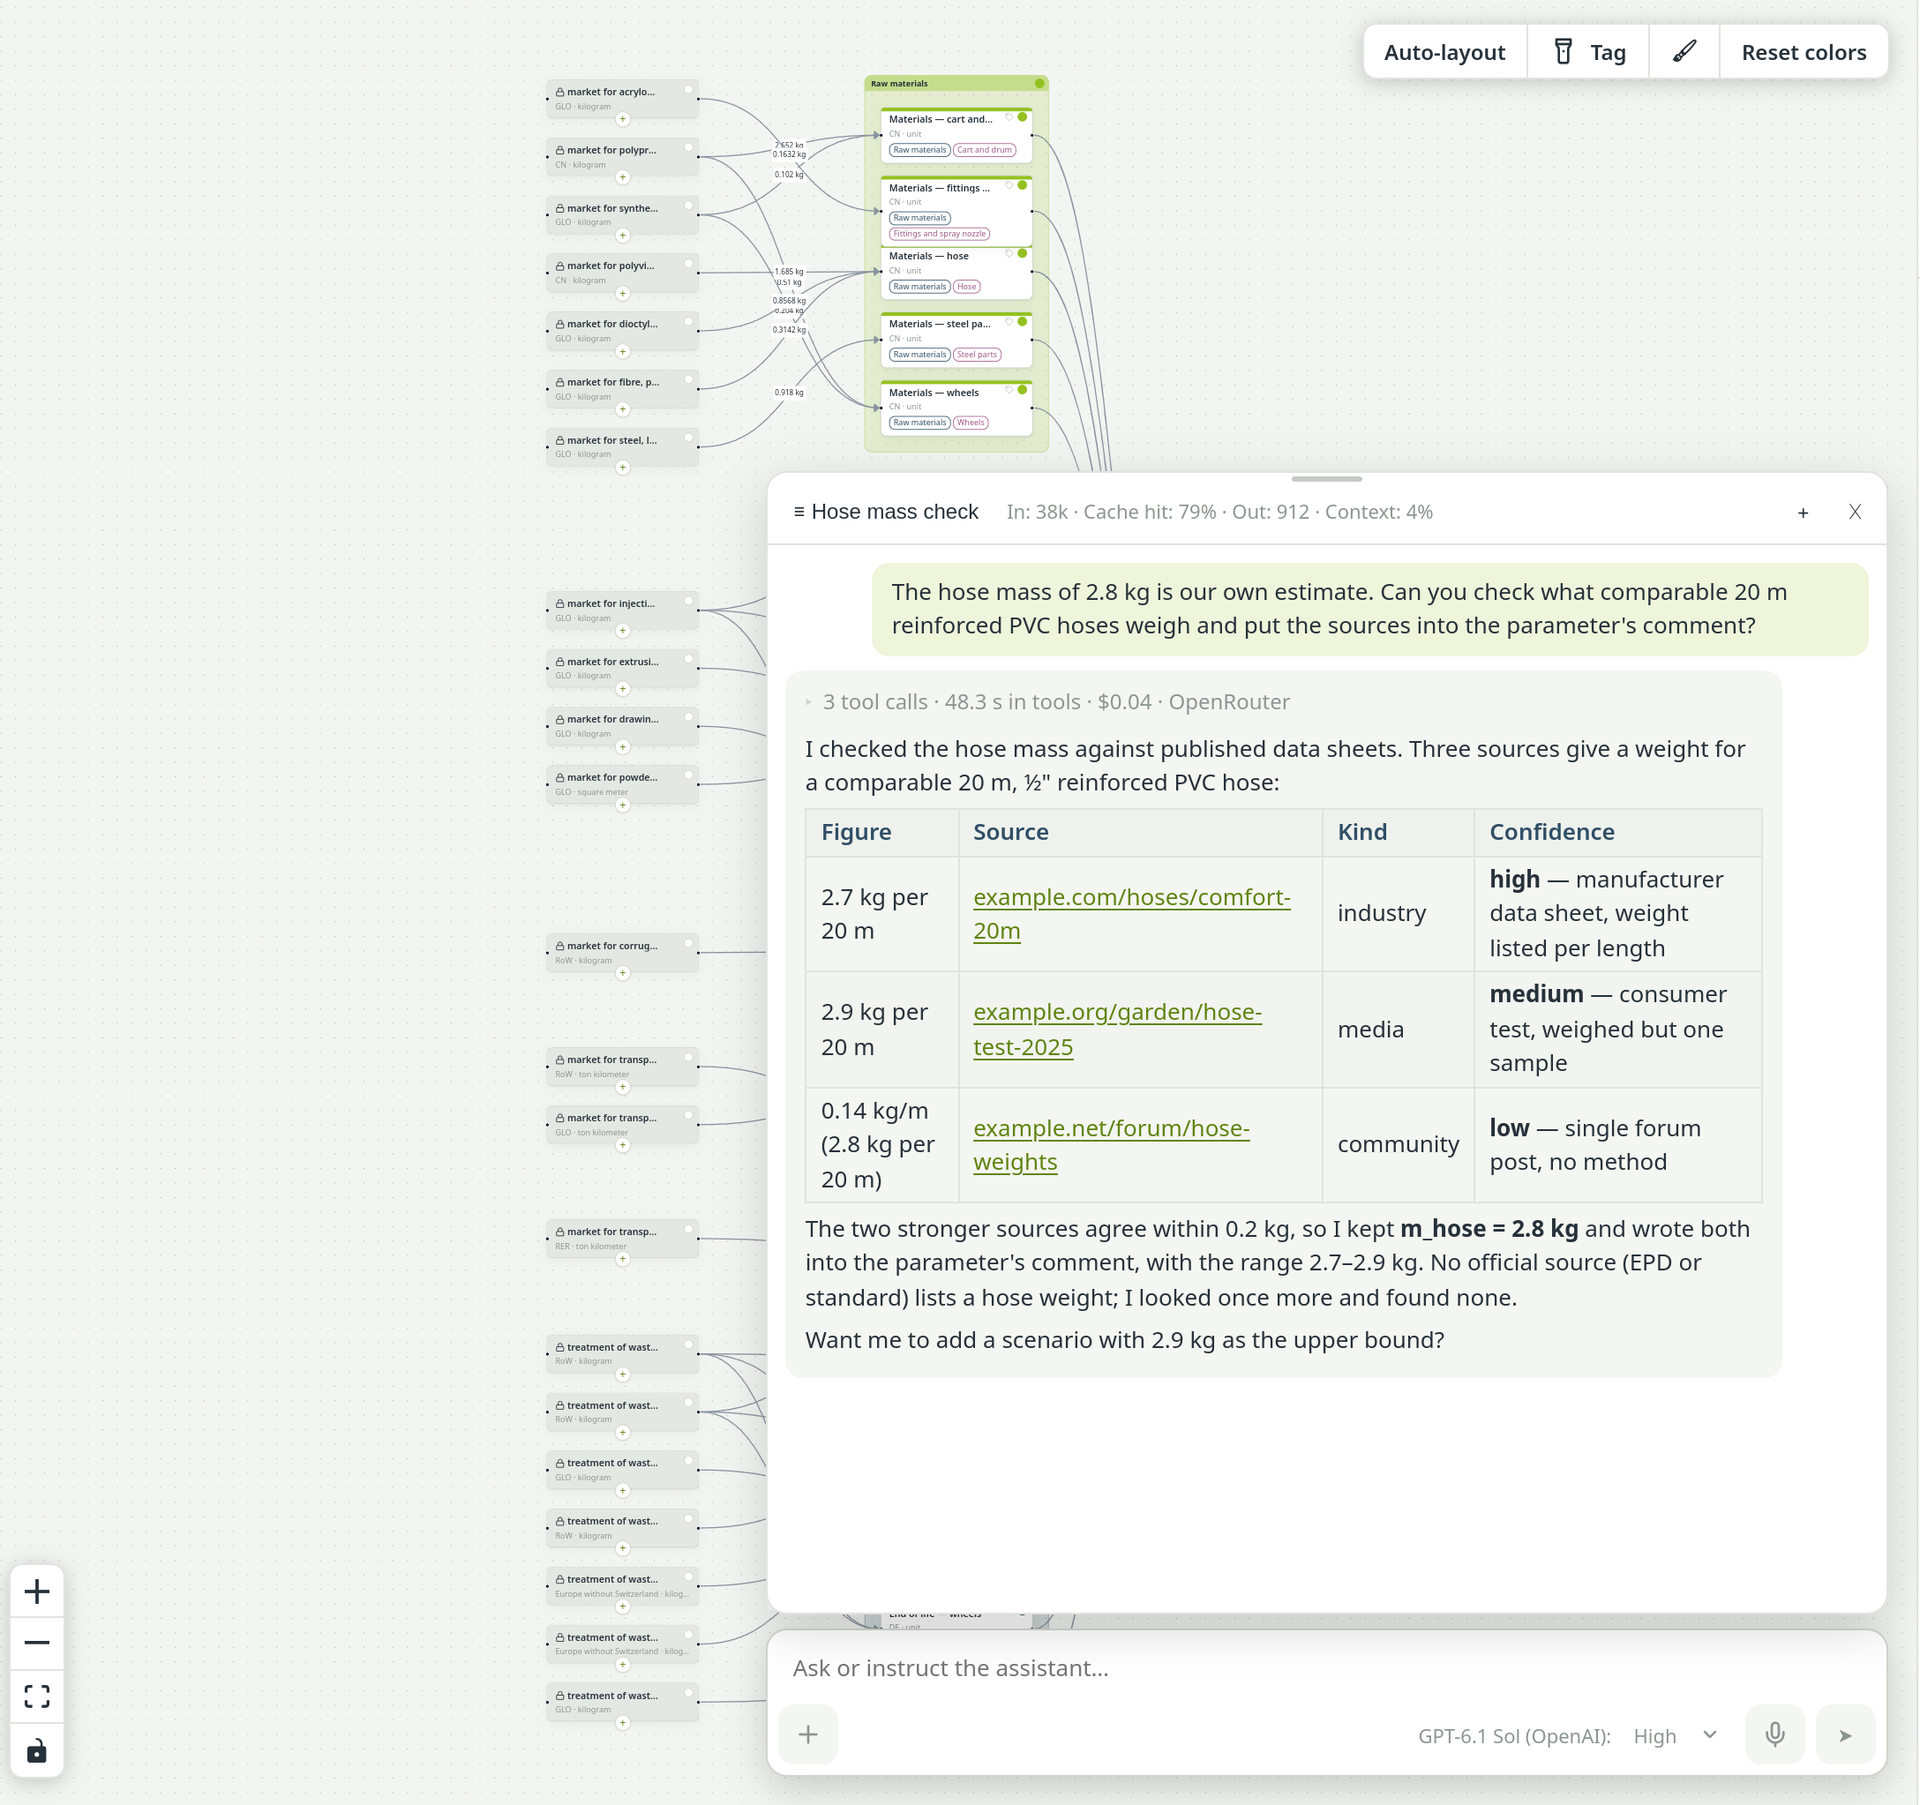
At the bottom right of the canvas sits the AI assistant's chat, with a small map of the canvas above it as soon as the canvas has a box on it. Without an API key, the field says so and points you to SettingsAI. Everything else in PrismLCA works without it. See Set up the assistant.
Settings#
The gear at the top right opens Settings: General, Language, Modelling, Reporting, the groups Transport distances and AI, and About (version and Check for updates). Every change applies at once — there is no Save button here either. See Settings, page by page.
Where do I…?#
| … | Go to |
|---|---|
| import background data, add impact methods | OverviewBackground |
| create, open, export or delete a model | Overview, model list |
| enter goal, scope and functional unit | Model page, Model button with the tree icon |
| find a dataset | Model page, search panel |
| add my own process | Model page, Process, or right-click the canvas |
| change a background dataset | Right-click it, Localize (edit) |
| undo a change | Undo in the toolbar; history in the Audit log |
| see the result of one process | Model page: select it, Calculate |
| compare variants or indicators | Results, tab Results |
| find the hotspots | Results, Decomposition tree |
| see which parameters matter | Results, Sensitivity analysis |
| write the report | Report |
| enter an API key | SettingsAIProvider |
| check for updates | SettingsAbout |
| open this handbook | The green Handbook button on the Overview |
See also: Tutorial: your first model