HandbookModelling
Life-cycle phases and tags
Tags sort your processes — and the inputs your model buys in — into life-cycle phases or any other dimension you need. Once your model is tagged, the results and the report can break the footprint down by phase, and you can see at a glance where the impact comes from.
Tag groups and tags#
A tag group is a dimension along which you want to break your model down. The typical one is called Life-cycle phase. Its tags are the allowed values, for example Production, Distribution, Use and End-of-life for your processes, and Raw materials for the materials they buy in. Each process carries at most one tag per group — a process is in one phase, not two — and so does each input. See the glossary for the other terms on this page.
You can have several groups side by side, for example Life-cycle phase and Component (reel, hose, fittings). Every group gets its own colour, and the tags show as small coloured labels on the process boxes on the canvas.
Manage groups in the Tags window#
Choose Tags in the model toolbar to open the Tags window. It lists every group with its tags.
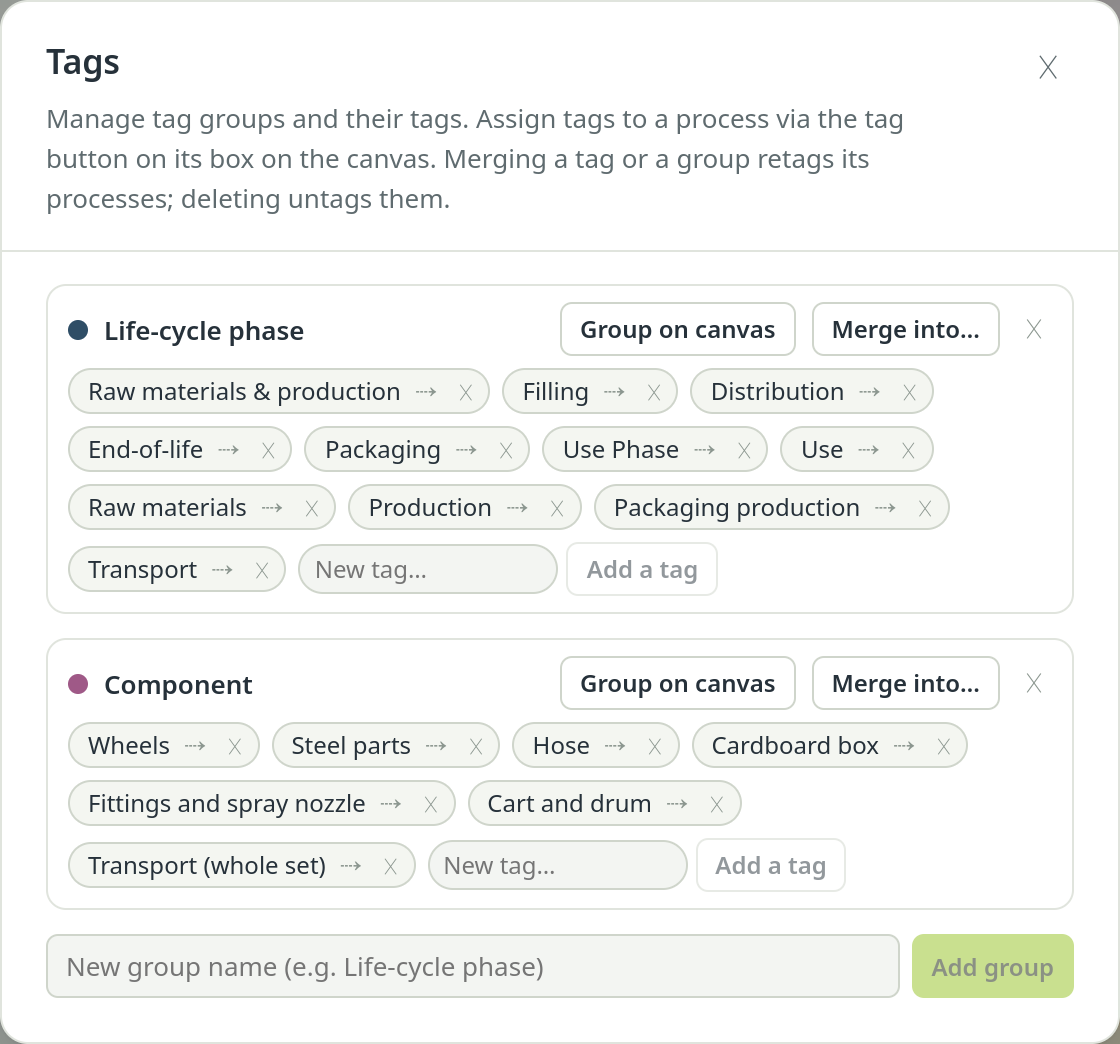
- Add a group: type a name into New group name (e.g. Life-cycle phase) and choose Add group.
- Add a tag: type it into New tag… under the group and choose Add a tag (or press Enter).
- Merge a tag: the arrow ⇢ on a tag folds it into another tag of the same group. Every process that carried it is retagged; the old spelling disappears.
- Merge a group: Merge into… beside a group moves all its tags and assignments into another group, and the first group disappears. Nothing is untagged.
- Remove: the ✕ on a tag removes it, the ✕ at the end of a group row deletes the whole group. Both untag every process that carried it, so PrismLCA asks first.
Tag your processes#
Open the tag menu on a process#
Every process box of your own model has a small tag button (Assign tags) beside its colour dot. Click it to open the tag menu. The boxes of background datasets, of My processes and of other models have the button too — but there you tag the input of your model that draws on the box, not the dataset itself (see the next section).
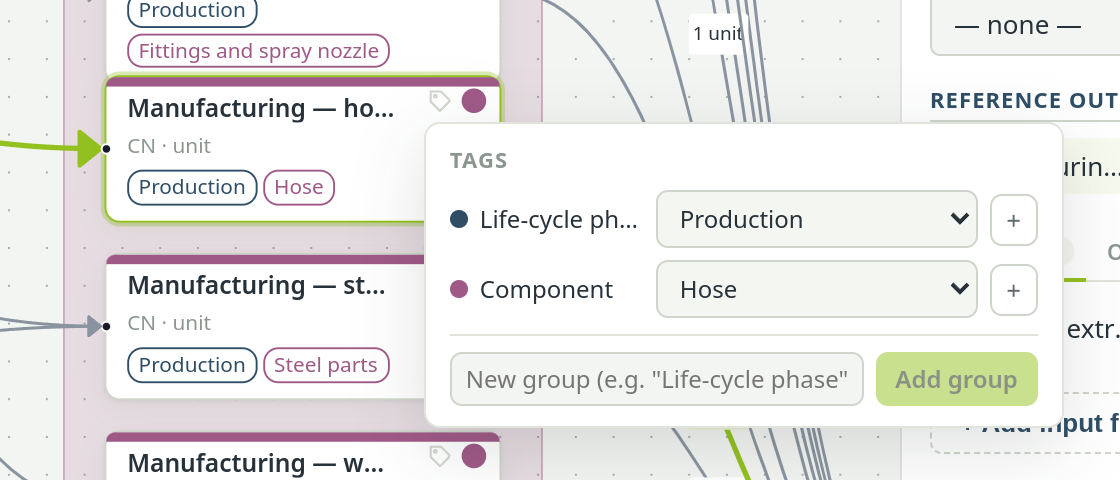
The tag menu: pick one tag per group, or add a new one on the spot. Pick a tag per group#
Each group has a dropdown. Choose a tag, or — none — to clear it. The + beside a group adds a new tag right there, and the field at the bottom adds a new group. With many groups the list scrolls; the field for a new group stays at the bottom.
Tag several processes at once#
Select several processes first (drag on empty canvas, or hold Shift or Ctrl while clicking), then open the tag menu on one of them. The tag you pick goes on every selected process of your model in one step.
The inspector shows the tags of the selected process under Tags. Every assignment lands in the audit log and can be undone.
Tag an input: a phase for what you buy in#
Your manufacturing step takes steel and the work of shaping it. The shaping belongs to production, but the steel is a raw material. Instead of a separate raw-materials process, you keep both inputs where they are used and give the steel input its own tag: Raw materials. The breakdown then shows raw materials and production apart, while the canvas still shows the bottle being made the way it is made.
Tag the box the input comes from#
Open the tag menu on the steel box and pick Raw materials. The tag goes onto the input — the arrow from the box into your process — and the box shows it. The dataset itself stays untouched: ecoinvent, BAFU, My processes and other models are shared by every model in the workspace, so a phase written into them would act everywhere at once.
One box per tag#
When two of your processes draw on the same dataset and their inputs end up with different tags — tagged on their own, or passed down from processes in different phases — the dataset stands on the canvas twice: one box per tag. If both processes draw on one box and you tag it, both inputs get the tag.
Need it twice under different tags? Drop it twice#
Drag the dataset from the search onto the canvas a second time. You get a second box of it; connect it to the other process and tag it on its own. A box you placed this way stays a box of its own, also before you tag it.
Only inputs from outside your model take a tag of their own. A process of your model is tagged on the process, so an input that comes from another process of the same model has no tag of its own.
See your phases on the canvas#
Two tools on the canvas make the tags visible:
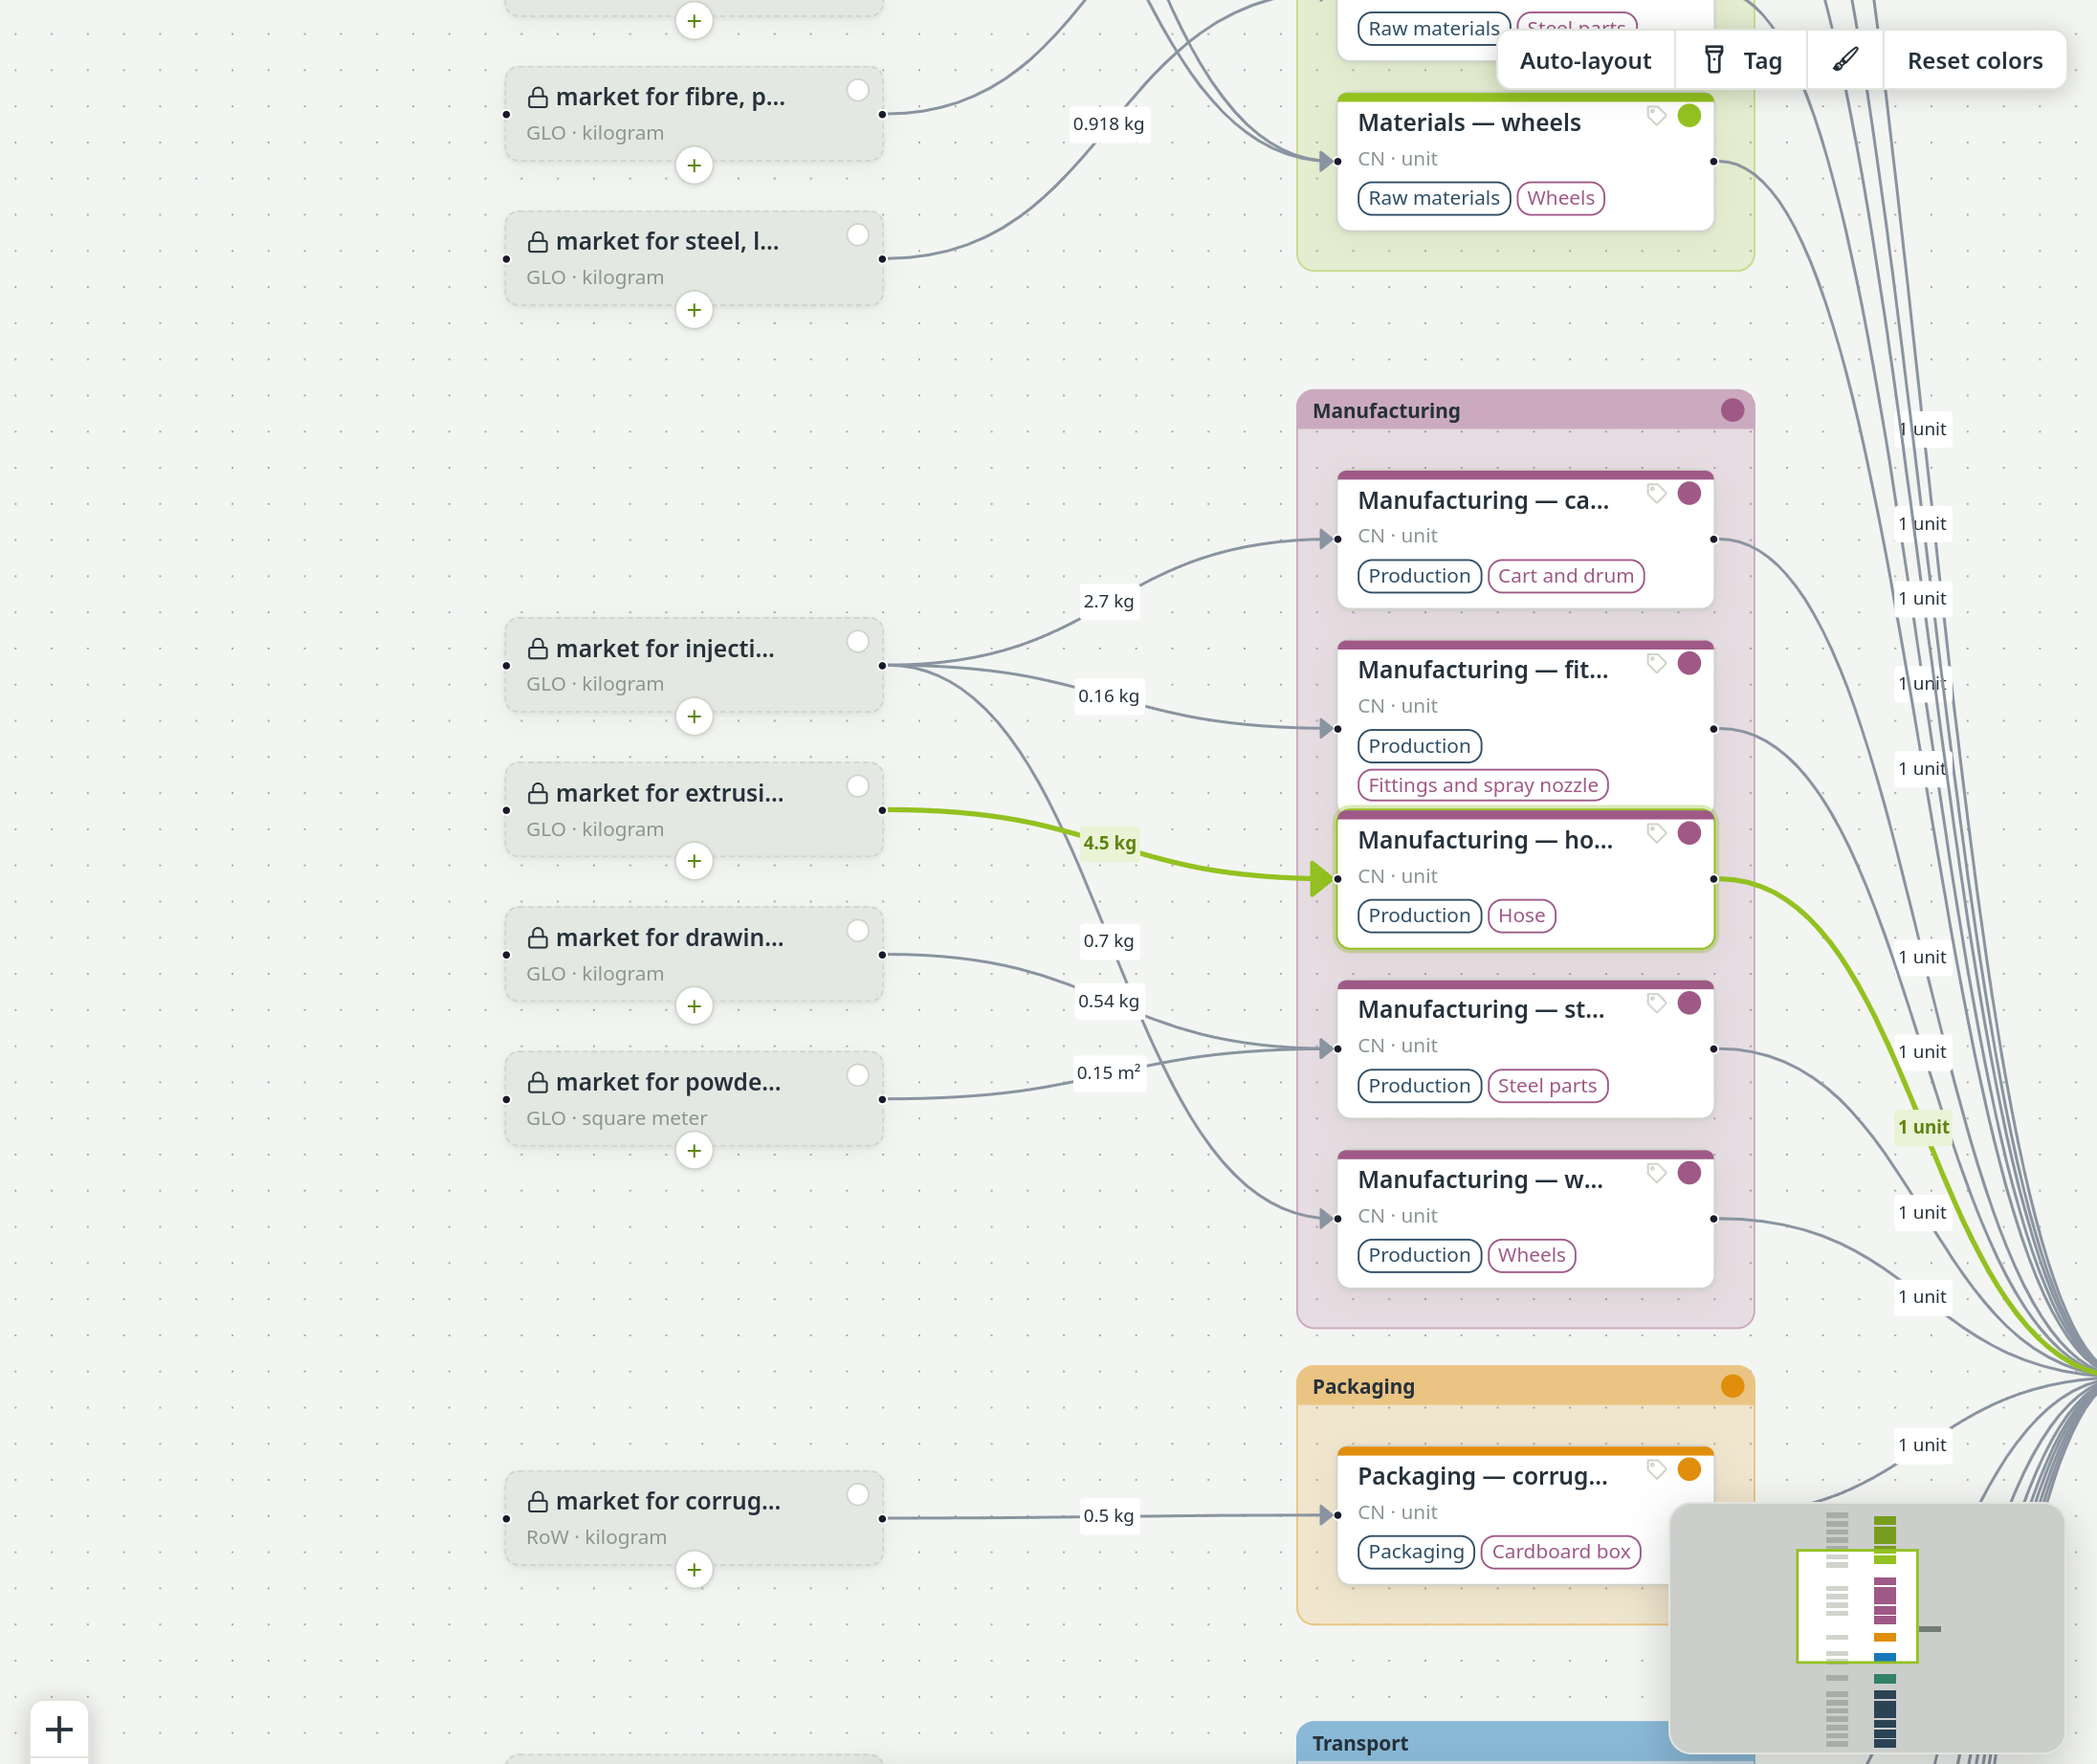
- Highlight a tag. The Tag button at the top right of the canvas lists the tags that processes on this canvas carry. Pick one and all processes carrying it light up; ✕ Clear highlight, at the top of the list, switches it off. Handy for checking a large model: is every transport process really tagged Transport?
- Group on canvas. In the Tags window, Group on canvas beside a group draws one tinted box per tag around its processes. A tag carried by a single process gets no box, and processes without a tag of that group stay outside. If a process carries two tags of the group, PrismLCA refuses and names the processes, so you can fix them first. The boxes are only a view — they change nothing in the model.
How tags drive the results#
Tags are what let PrismLCA answer “which phase causes the impact?”. Three places use them:
- Decomposition tree: Group by sums the contribution tree per tag of the chosen group — see Find the hotspots.
- Results (the first tab): with Stacked bars / disaggregated exports switched on, Split by offers Tag: Life-cycle phase (or any other group in use) next to the ISIC and CPC classifications. The bars and the Excel export then come apart by phase.
- Reports: the full report's Contribution breakdown and the short report's Break the contribution down by list your tag groups, and the charts and hotspot tables follow them.
Only groups that are actually used in the model are offered. A group nobody has tagged would produce a single bar called “untagged”. The breakdown is exact however the processes hang together — side by side, in a chain, or both.
A phase structure that works#
A clean structure makes the breakdown trustworthy. These habits have proved themselves:
- One group, a handful of tags. Call the group Life-cycle phase. Tag your steps Production, Distribution, Use and End-of-life, the materials they buy in Raw materials, and the freight that brings those materials to the plant Inbound transport. Leave out stages that are outside your system boundary, and add a tag of your own where the product has a stage these do not cover.
- The life cycle on top, the product's chain beneath it. The reference process — your functional unit — takes the delivered product, the use and the end of life side by side. Beneath the delivered product, distribution takes the manufactured product, and manufacturing takes the materials and the processing that turns them into it. Only the link from the reference process converts to the functional unit (say 0.002 bottles per litre carried).
- Material and processing in the same step. A processing dataset (injection moulding, deep drawing) covers the work, not the material, so the material is its second input in the same process — with the input tag Raw materials.
- Tag every step. A step without a tag counts under the step that uses it. That is right for a helper two steps share and wrong for a step you forgot.
- Never tag the reference process. It is the functional unit, not a phase. Because every untagged process inherits from it, a tag on it would quietly put everything untagged into that phase.
- Keep the group name in English. The group name is how models are matched, so it stays Life-cycle phase even in a German study. The tags themselves follow the study's language; the report translates the printed group name for you.
A model built the older way, with one process holding all materials beside one holding all processing under the reference process, still calculates correctly. There is no need to rebuild it.
See also: Build on the canvas · The short report