HandbookModelling
Scenarios
A scenario answers a what-if question — a recycled-plastic reel, a longer transport route — without touching your model. You set different values for a few parameters, and Results shows each scenario next to the baseline.
How scenarios work#
A scenario is a named set of parameter overrides, laid on top of your model as it stands (the baseline). Each override gives one parameter a different value for that scenario; every parameter you do not touch keeps its baseline value. The model itself never changes.
So scenarios need parameters. The numbers you want to vary must be parameters, and the amounts on the canvas must use them in formulas. Until the model has at least one parameter, the button that creates a scenario stays disabled.
Create a scenario#
Open Scenarios in the sidebar.
Start a new one#
Choose Scenario (the button with the plus) at the top of the page. The New scenario sheet opens.
Name and describe it#
Fill in Name and, optionally, Description — what the scenario represents and where its values come from.
Tick the parameters it changes#
Under Overrides, all parameters are listed by group with their baseline value. Tick a parameter to give it a scenario value; unticked parameters keep the baseline.
Enter the new values#
Type a number or a formula, such as
1.2 * distance_km. A parameter with a list rule offers its allowed values as a dropdown. Then choose Create.
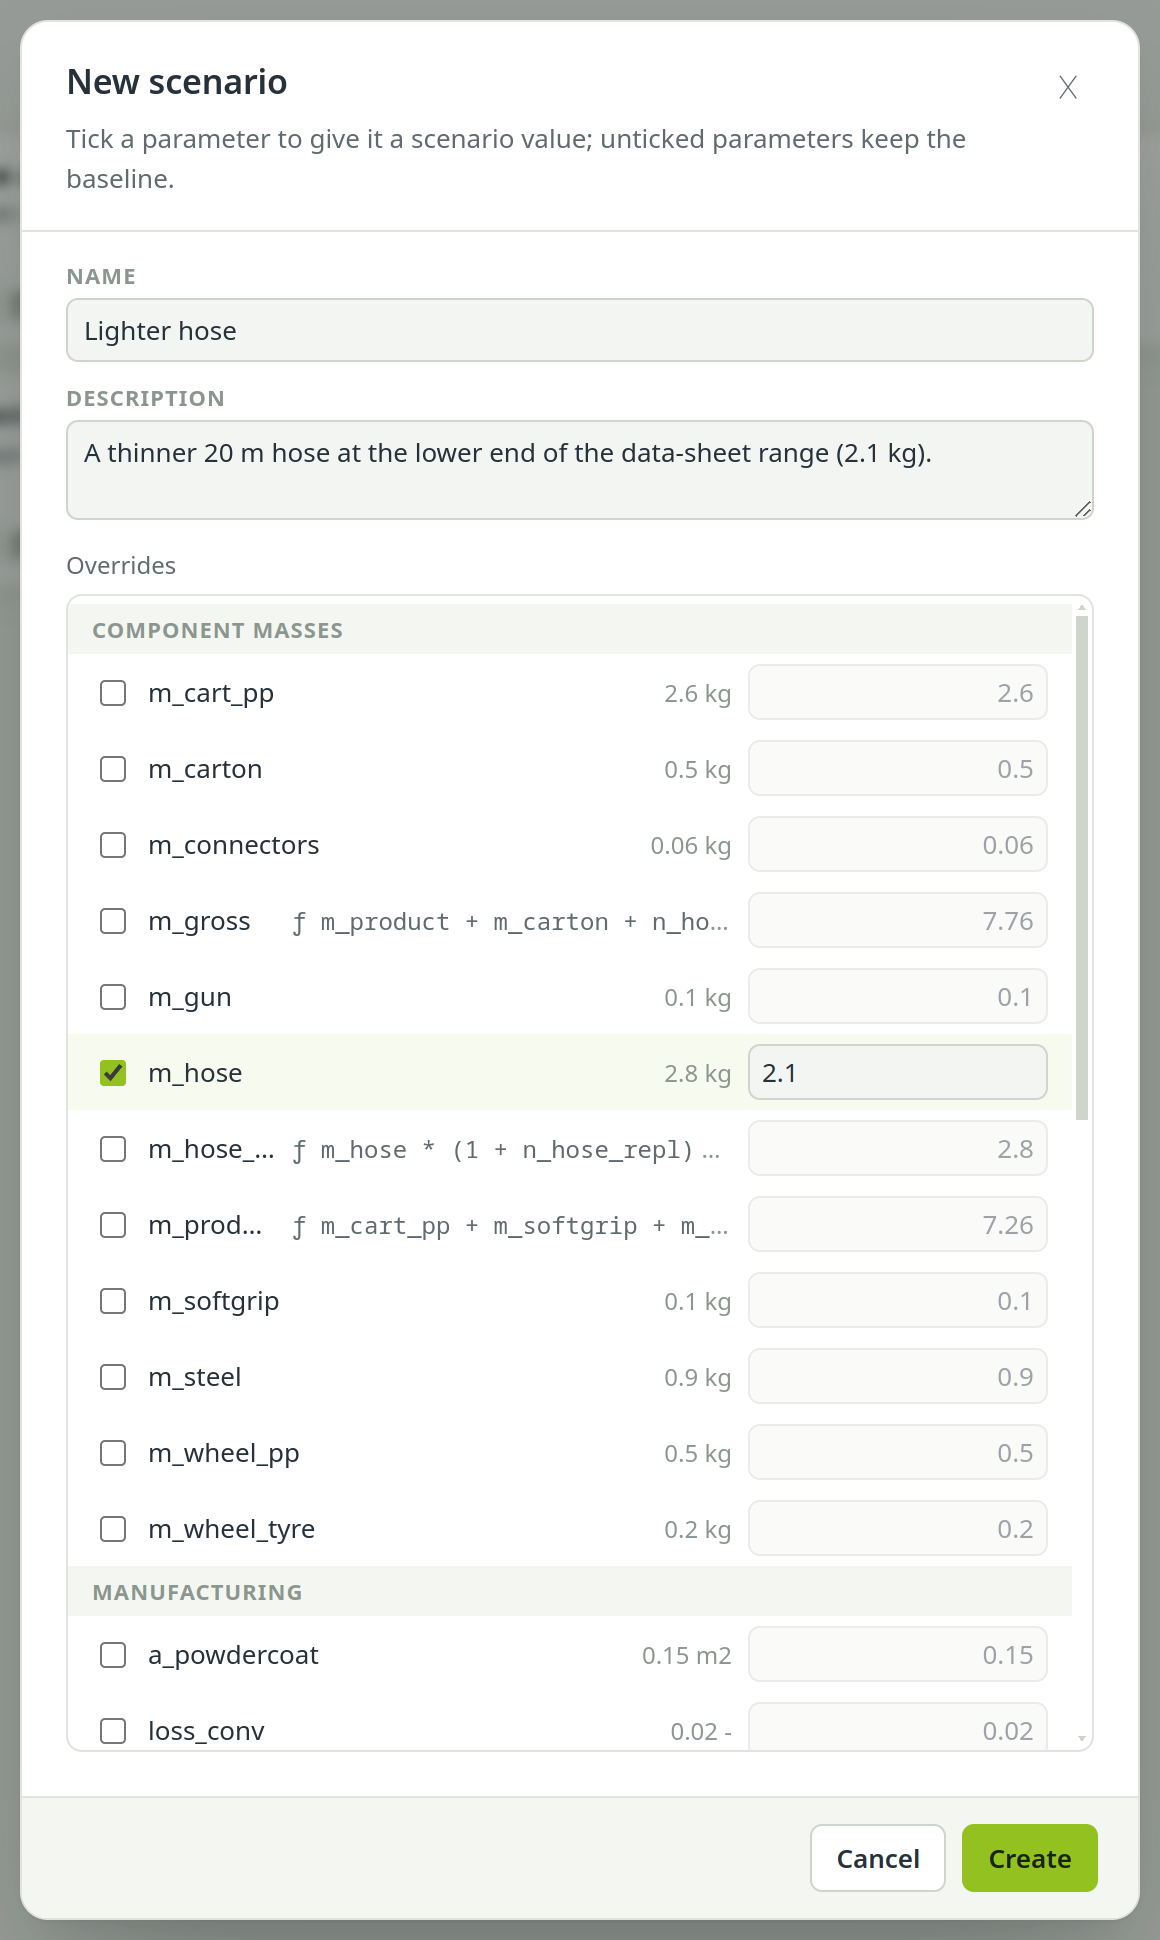
Values that break a parameter's rule, or formulas that cannot be read, are refused before anything is stored; the sheet names the parameters concerned.
Overriding a parameter that has a formula#
If the parameter is itself computed — packaging = hose_mass * 0.05 — the sheet shows its formula, and the
override replaces that formula in the scenario. The scenario's details say so: Replaces the parameter's formula in
this scenario.
Review and edit scenarios#
Each scenario is a card with its name, description and the number of overrides. Click a card to see its overrides on the right: each parameter with its baseline value, an arrow and the scenario value. Baseline values are read live from your current parameters, so a scenario always varies today's model.
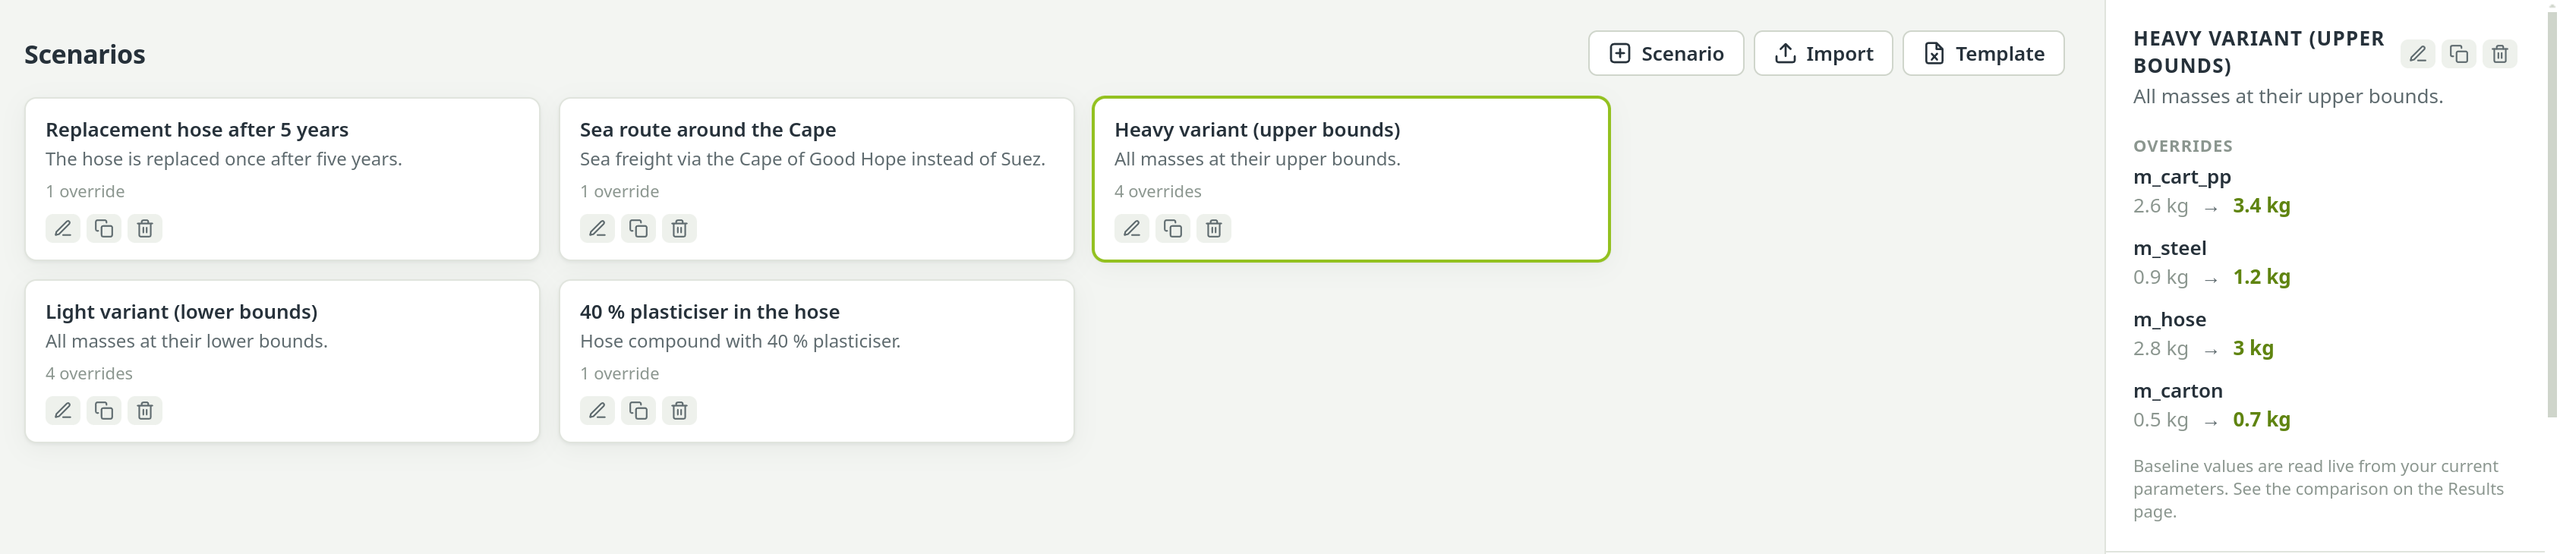
- The buttons on a card edit, duplicate or delete the scenario; a double-click also opens it for editing.
- While editing, changes are saved as you make them. Close closes the sheet; there is no save button.
- same as the model next to an override means the parameter already holds that value, so the override changes nothing. A card that says … change nothing may return exactly the baseline result.
Import scenarios from Excel#
For many scenarios, or values that come from a colleague's spreadsheet, use a workbook:
Get the template#
Template downloads an example workbook for this model. The first column lists the model's parameters; the first row holds scenario names. Scenario A is prefilled with the baseline values, Scenario B is empty.
Fill it in#
One column per scenario, one row per parameter. A filled cell — including 0 — sets an override. An empty cell keeps the baseline. A text cell is read as a formula.
Import it#
Import reads the workbook. A column whose name matches an existing scenario updates that scenario; a new name creates a new one. The page reports how many were created and how many overwritten.
| parameter | Recycled PP reel | Long transport |
|---|---|---|
| recycled_share | 0.8 | |
| distance_km | 24000 | |
| hose_mass |
The import is all or nothing: if one cell breaks a rule or cannot be read, nothing is imported, and the message says which parameter and scenario are at fault. Like every change, the import appears in the audit log and can be undone.
See scenarios in Results#
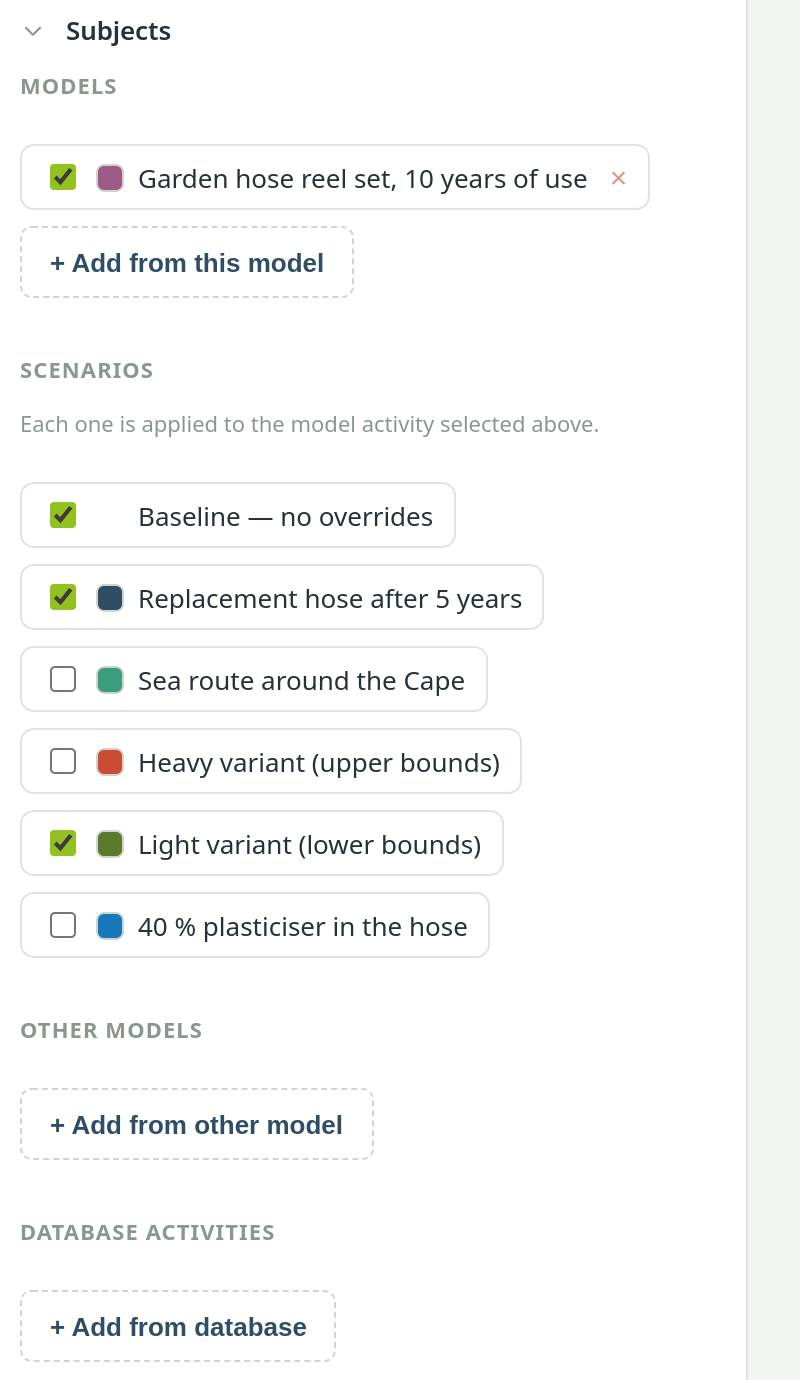
The Scenarios page has no charts of its own. Open Results: under Subjects, the model's scenarios are listed beneath its processes, together with Baseline — no overrides.
Pick the process#
Select the model process to compare — normally your product. Each scenario is applied to the processes selected there.
Tick the scenarios#
Tick the baseline and the scenarios you want to compare. Each scenario has its own colour swatch for the charts.
Calculate#
Choose Calculate. The scenarios appear as subjects in the charts, the stacked bars and the Excel export.
How to read the comparison — differences to a reference, per indicator or normalised — is explained in Compare results.
Good practice#
- Name a scenario by the question it answers: “Recycled PP reel”, “Shipped by rail via Silk Road” — not “Scenario 2”. The name is what appears in every chart and in the report.
- Change as little as possible. A scenario that changes one or two parameters can be explained; one that changes ten leaves the reader guessing which change mattered.
- Write the source into the description — where the scenario values come from, and why they are plausible.
- Use rules on the parameters so a scenario cannot set a share above 1 or a negative mass.
- Check the baseline is still the baseline. If you change a parameter on the Parameters page, every scenario varies the new value.
See also: The short report